Table of Contents
Every budget season, the same thing happens. Experiential is the line item that delivered the photos everyone loved, the activation that drew the biggest crowd, the moment that filled the company's social feed. And it is also the first line item someone asks to defend. Not because the results were not there, but because the industry has spent a decade measuring experiences in smiles instead of numbers. That gap is closing fast. By 2026, leads and data capture have overtaken foot traffic as the metric brands care about most for live events, and the teams winning budget are the ones who can hand finance a number, not a feeling.
This is the framework we use with our own clients and recommend to any team running brand activations at scale. It covers what to measure, how to capture it, what good looks like against published benchmarks, and the one shift that separates teams who prove ROI from teams who guess at it. If you want the underlying math (Value Per Lead, pipeline multiples, the post-event report), our companion guide on how to measure event activation ROI walks through the formulas. This guide is the strategy that sits above them.
Why Experiential Marketing Has a Measurement Problem
Ask ten brand managers how they measured their last activation and you will get ten different answers, or a long pause. The struggle is real and well documented: surveys consistently put proving ROI at the top of the experiential challenge list, with roughly four in ten marketers naming it their single biggest hurdle. The difficulty is not a lack of effort. It is structural, and it comes from three places.
Multiple objectives, no single metric. A digital ad has one currency: click-through to conversion. An activation serves awareness, sentiment, lead capture, earned media, and community all at once. No single number captures all of that, so teams default to the easiest one to count (footfall) and quietly ignore the rest.
Passive formats produce passive data. A branded backdrop tells you how many people walked past. It cannot tell you who stopped, who engaged, who left with a changed opinion, or who you can follow up with. If the experience is not built to capture data, there is nothing to measure after the teardown.
No standard reporting framework. Without a consistent template, every activation gets reported differently. One client gets a reach figure, another gets a footfall count, a third gets a press summary. None are comparable, and none answer the only question the board is asking: was it worth it?
None of these are unsolvable. They just require treating measurement as a design decision, not an afterthought. The rest of this guide gives you the structure to do that.
From ROI to Return on Experience
The most useful shift in the last few years is conceptual. Leading teams stopped treating an activation as a one-off event with a cost and a payoff, and started treating it as a physical-to-digital data funnel. The experience happens in the room. The value compounds afterward, online, in the pipeline, and in the brand. The industry shorthand for this wider lens is Return on Experience (ROE): the full set of outcomes a live moment produces, not just the deals that close in the same quarter.
That reframing matters because the spend is following it. Global experiential spend hit a record $128.35 billion in 2024, finally passing pre-pandemic levels (PQ Media), and 84% of consumer marketers plan to increase event spending in 2026, with B2B marketers close behind at 86% (EventTrack 2026). Money is moving toward live experiences precisely because the channel has learned to prove itself. The framework below is how that proof gets built.
The Four Layers of Experiential ROI
The most reliable way to measure an activation is to capture value at four layers, each mapping to a different point in the guest journey. Not every activation needs all four with equal weight. A festival awareness play leans on the first two; a trade show lead engine lives in the fourth. But building your measurement plan around all four from the start means your post-event report captures the full return, instead of the one slice that happened to be easy to count.
| Layer | What it measures | Core KPIs | How it's captured |
|---|---|---|---|
| 1. Reach | The total surface area of the activation, in the room and online. | Footfall and impressions, marketing fuel (user-generated content) share rate, earned media value. | Footfall counters, branded hashtag and social listening, content share tracking. |
| 2. Engagement | The depth of interaction, past the passive walk-by. | Average dwell time, participation and interaction rate, repeat-play rate. | Interaction logs from the experience itself, dwell-time tracking, gamification data. |
| 3. Affinity | The shift in how people feel about the brand. | Net Promoter Score lift, sentiment and brand favorability, aided and unaided recall. | Post-experience micro-surveys, automated follow-up email loops, social sentiment analysis. |
| 4. Pipeline | The direct line to revenue. | First-party data capture rate, cost per qualified lead, pipeline multiple, customer lifetime value match. | Built-in lead capture at the moment of engagement, exported for your CRM, then traced to closed revenue. |
The connective tissue across all four layers is data capture. A reach number you cannot tie to a name is a vanity metric. An engagement that does not produce an opt-in is entertainment. What turns each layer into ROI is the ability to connect the moment in the room to a record you can act on later. That is the thread running through everything below.

What Good Looks Like: 2026 Benchmarks
The hardest part of measurement is often the absence of a reference point. These benchmarks give you a baseline to judge against. Each is labeled by how well it is sourced: verified figures trace to the original research, estimates are real but widely circulated benchmarks without a single primary study. We left out the dwell-time and earned-media numbers common to other guides, because their usual attributions (often to Forrester or Forbes) do not hold up under checking.
| Benchmark | What the data says | Source |
|---|---|---|
| Purchase intent | 98% of attendees said a live experience made them more inclined to purchase, when the product was one they cared about. | Verified, EventTrack |
| Repeat purchase | 70% of attendees who buy once go on to become repeat customers. | Verified, EventTrack |
| Content creation | 98% of consumers create digital or social content at events, and effectively all of them share it. | Verified, EventTrack |
| Brand perception | 74% leave with a more positive opinion of the brand after the event. | Verified, EventTrack |
| Return on spend | Commonly cited at 3:1 to 5:1, with standout activations reaching higher. Directional, not a measured average. | Industry estimate |
| UGC engagement | User-generated content tends to earn around 28% higher engagement than brand-only content. | Industry estimate (comScore, via secondary) |
Treat these as the floor, not the goal. The most useful benchmark will always be your own historical data: this activation's cost per lead against your last one, its pipeline multiple, its conversion rate versus your other channels. Industry averages get you in the room with finance. Your own trend line is what wins the bigger budget.
Project Your Activation's ROI
The benchmarks tell you what good looks like. This calculator tells you what your own activation is on track to return. Enter your cost, lead count, and conversion rate to see projected revenue, ROI, the pipeline multiple, and lifetime value, using the same method this guide describes.
The Three Metrics Driving Strategy Right Now
Top-of-funnel reach is fine for baseline reporting. But the teams driving the most business impact concentrate on three specific indicators, because each one connects a live moment to a downstream outcome you can defend.
The marketing fuel multiplier. It is no longer about how many people are in the room. It is about the share of them who pull out a phone to co-create and post content. Because user-generated content tends to earn meaningfully higher engagement than brand-only posts (industry estimates put it around 28%), the share rate (total social posts divided by total participants) has become a core efficiency metric. Every guest who shares a branded moment is buying you reach you did not pay for. Our deeper take on this lives in how experiential activations generate marketing fuel.
Dwell time distribution. A flat average hides the story. What matters is the curve: how many people lingered for seconds versus several minutes. Deep engagement, the kind measured in minutes rather than the seconds a passing digital ad earns, is where real intent forms. The question is not “how long on average,” but “how much of the audience reached the depth that actually moves the needle.”
First-party data capture efficiency. As third-party tracking degrades, a live activation has quietly become one of the cleanest first-party data channels a brand has. The metric to track is cost per qualified lead (total activation cost divided by opt-ins with real interaction history), measured directly against your digital customer acquisition cost. When event leads convert at 15% and paid search leads convert at 3%, even a modest activation can be your most efficient acquisition channel. This is the layer most teams under-build, and the one with the most upside.
The Shift That Changes Everything: Design Measurement In Before the Event
Here is the single most important principle in this guide. Measurement is not what you do after an activation. It is what you build into it from the start. Teams that try to reconstruct data after the teardown consistently under-report, because the capture mechanisms were never in place. The technology that captures your ROI data is as important as the technology that creates the experience.
That means four decisions before anyone shows up:
Define one primary objective and two or three secondary ones. Awareness at scale, lead generation, sentiment lift, community building. The primary objective decides which of the four layers you weight most heavily and which KPIs make your report.
Identify your capture mechanism for each layer. Walk the four layers and name the tool or method that produces each number. The gaps you find now are the metrics you would otherwise lose. Sentiment, in particular, almost always needs a deliberate mechanism: a post-experience micro-survey or a follow-up email loop.
Set your baselines. Post-event awareness and sentiment numbers only mean something against a pre-event reference point for the same audience segment. Capture the baseline before you go live.
Agree the reporting template up front. Decide which metrics appear in the final report, how each is calculated, and what success looks like for each, before the activation runs. This is what makes the post-event report a one-day build instead of a three-week archaeology project.
Why First-Party Data Is the Layer That Pays
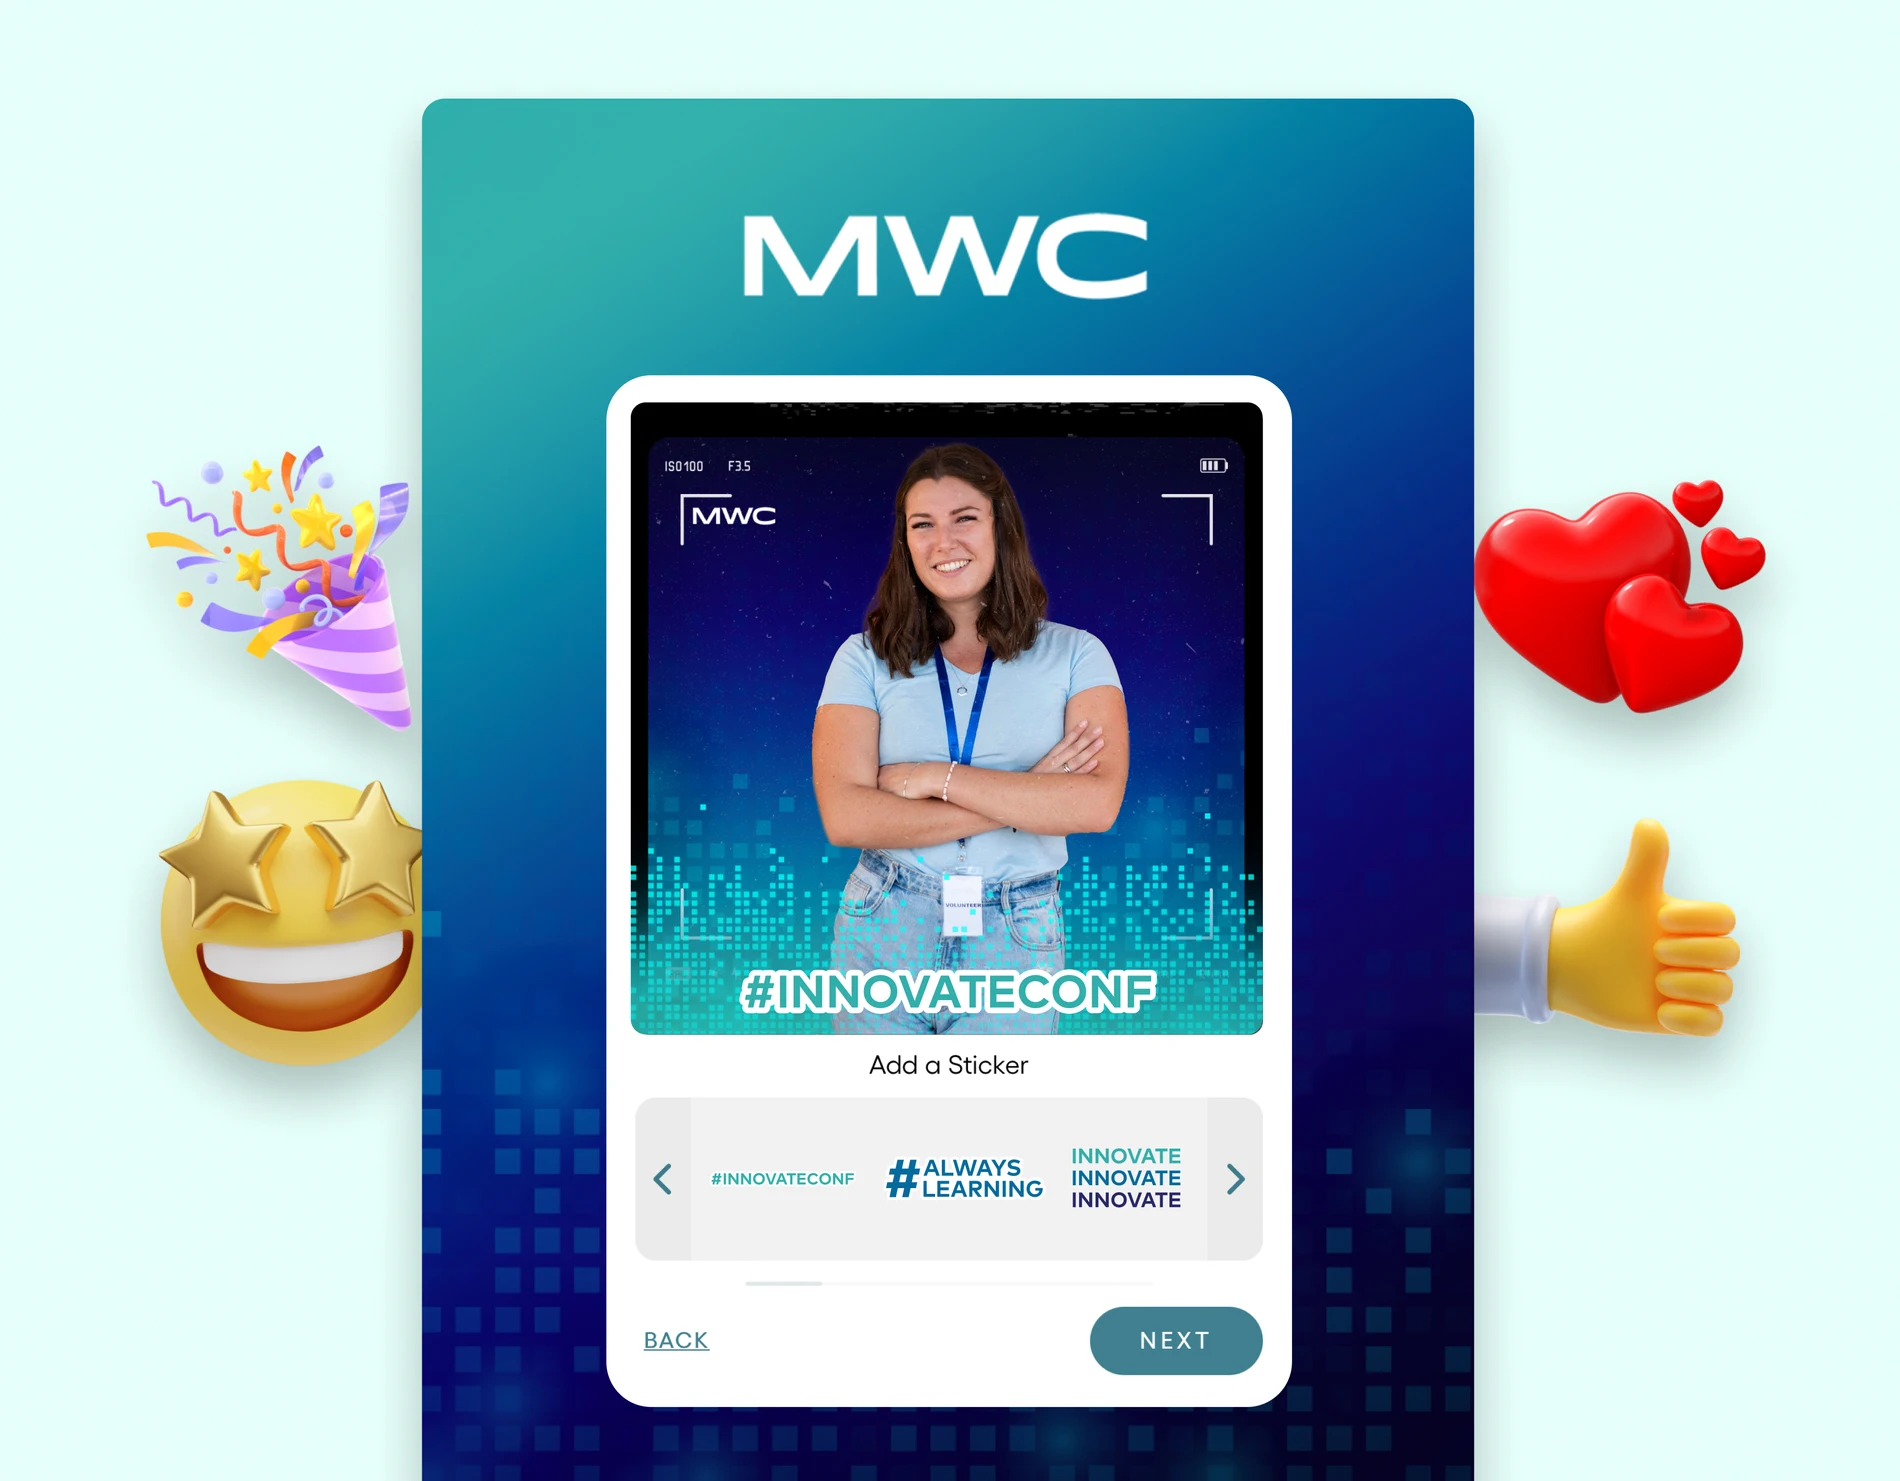
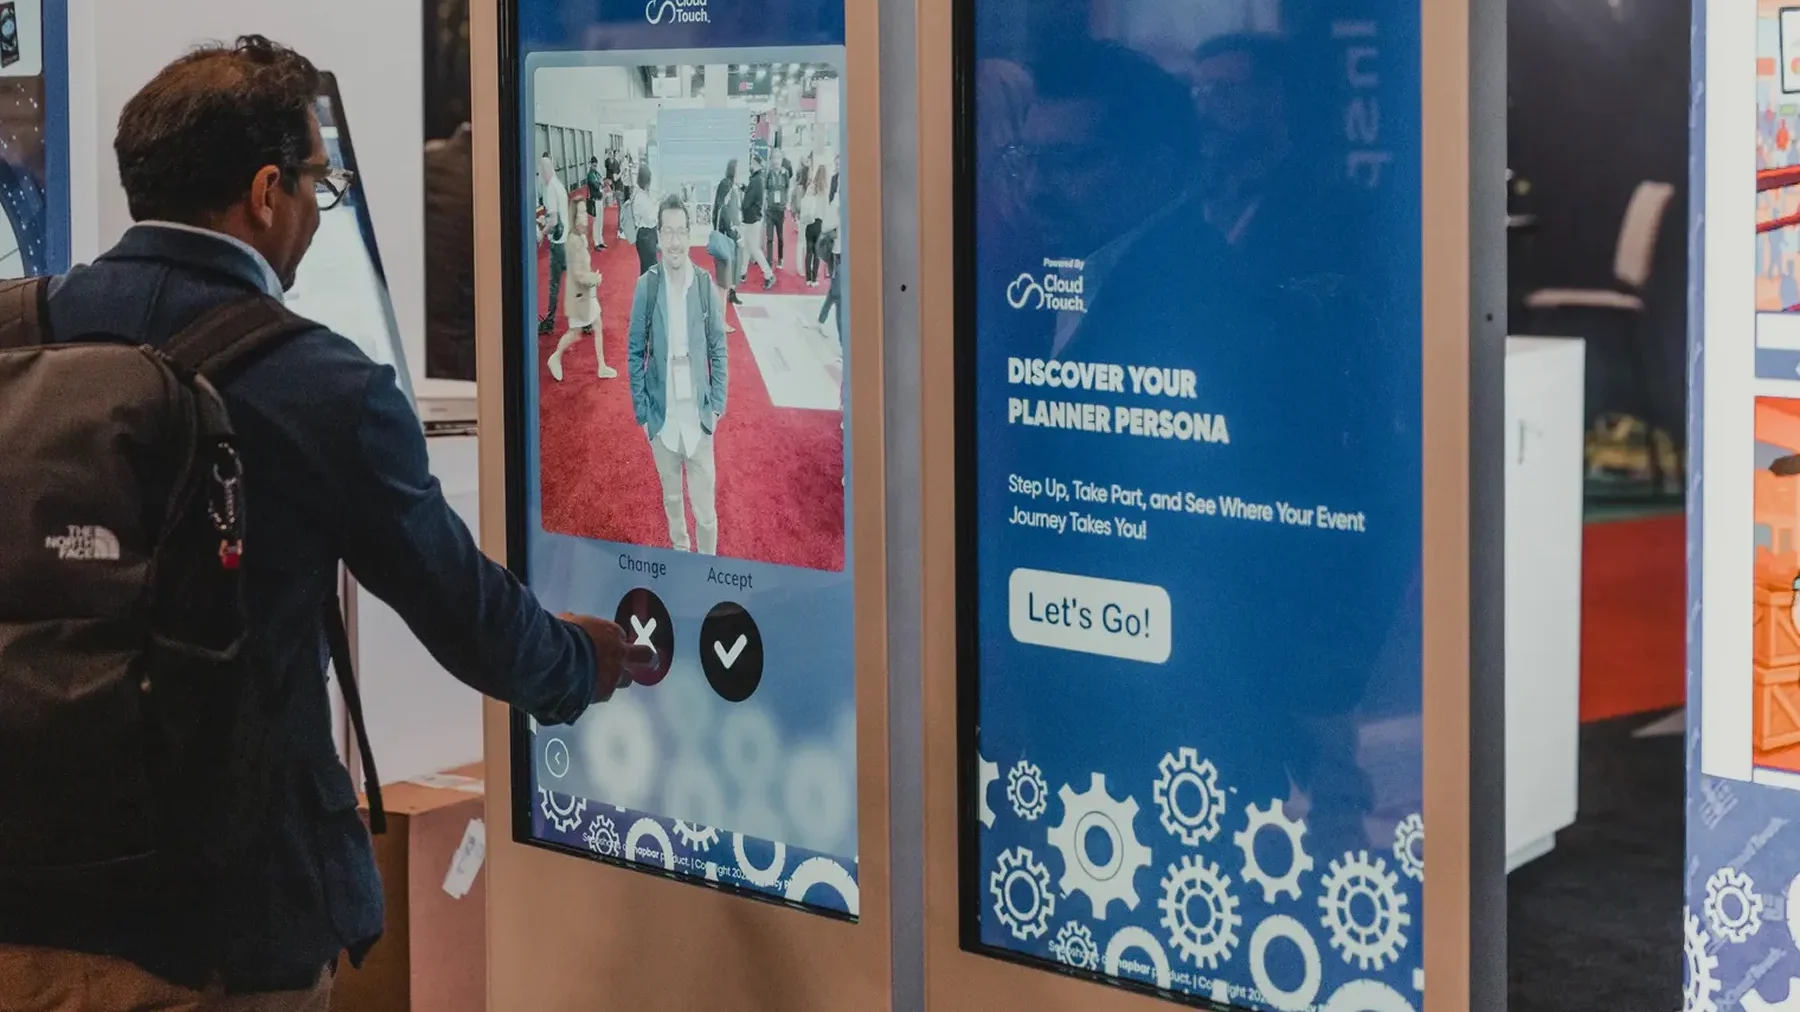
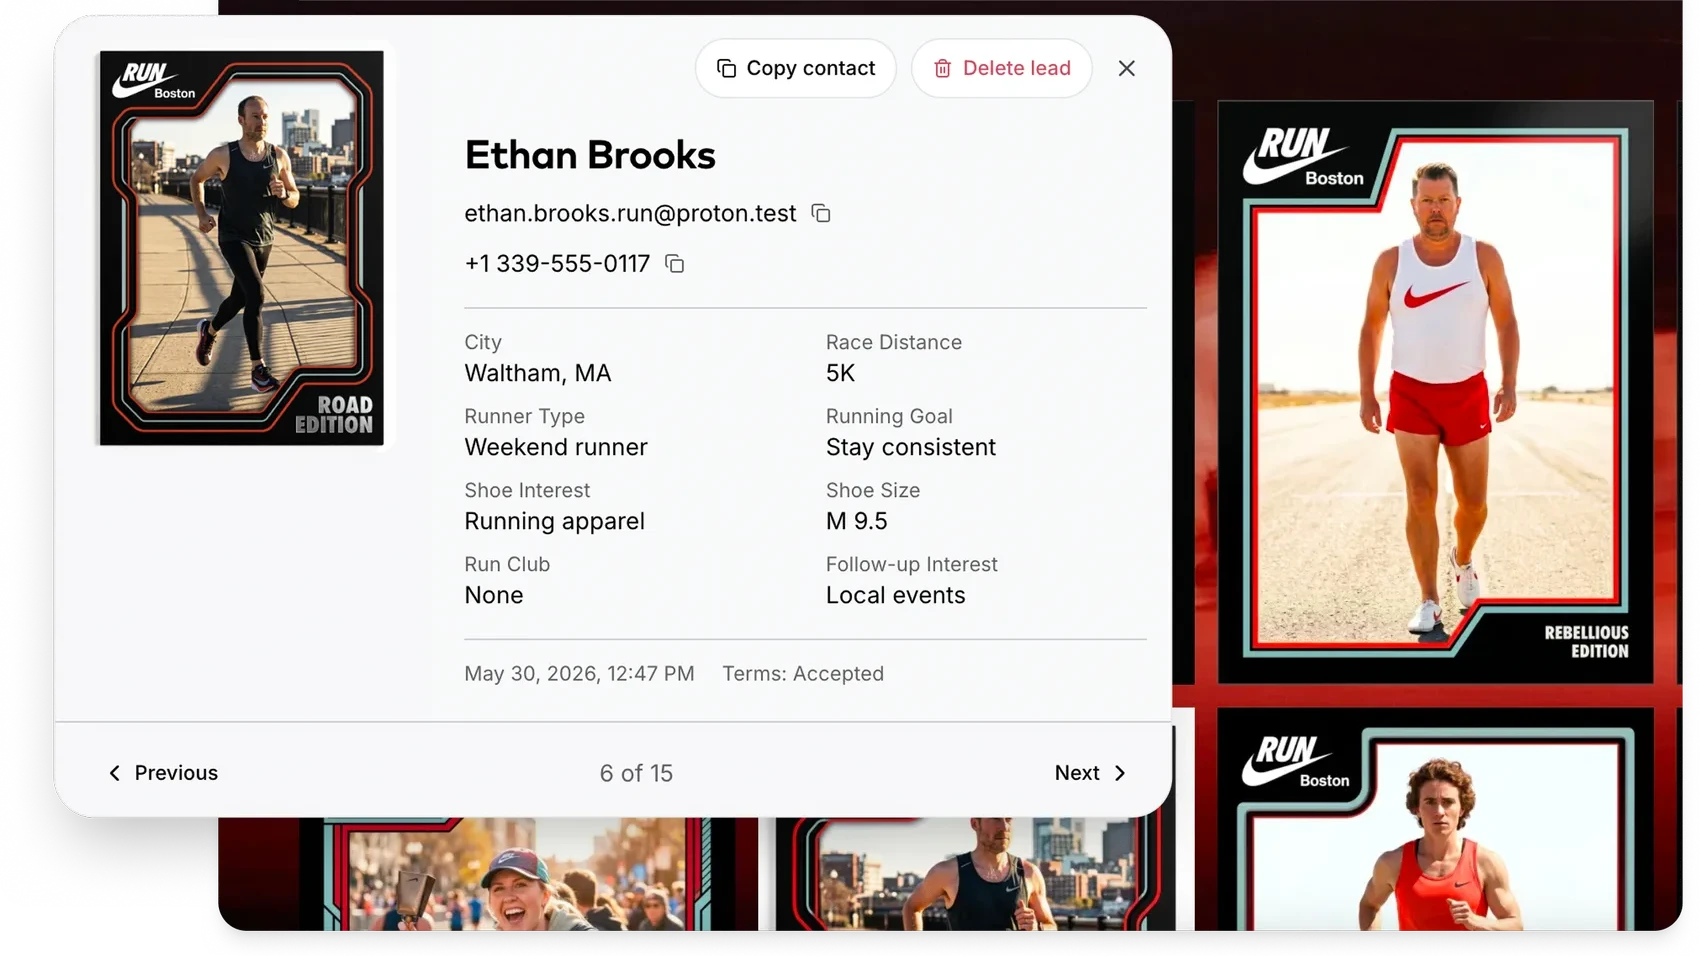
Of the four layers, Pipeline is where experiential earns its seat at the table, and it hinges on one design choice: how you capture data in the room. The approach we build every activation around is a natural value exchange. Instead of asking people to fill out a form before they can participate, you create an experience valuable enough that guests want to share their information to receive the output. Someone takes a branded photo, enters an email to get it, and in the same flow opts into your list or answers a qualifying question. No clipboard. No awkward pitch. The data collection is embedded in the moment itself.
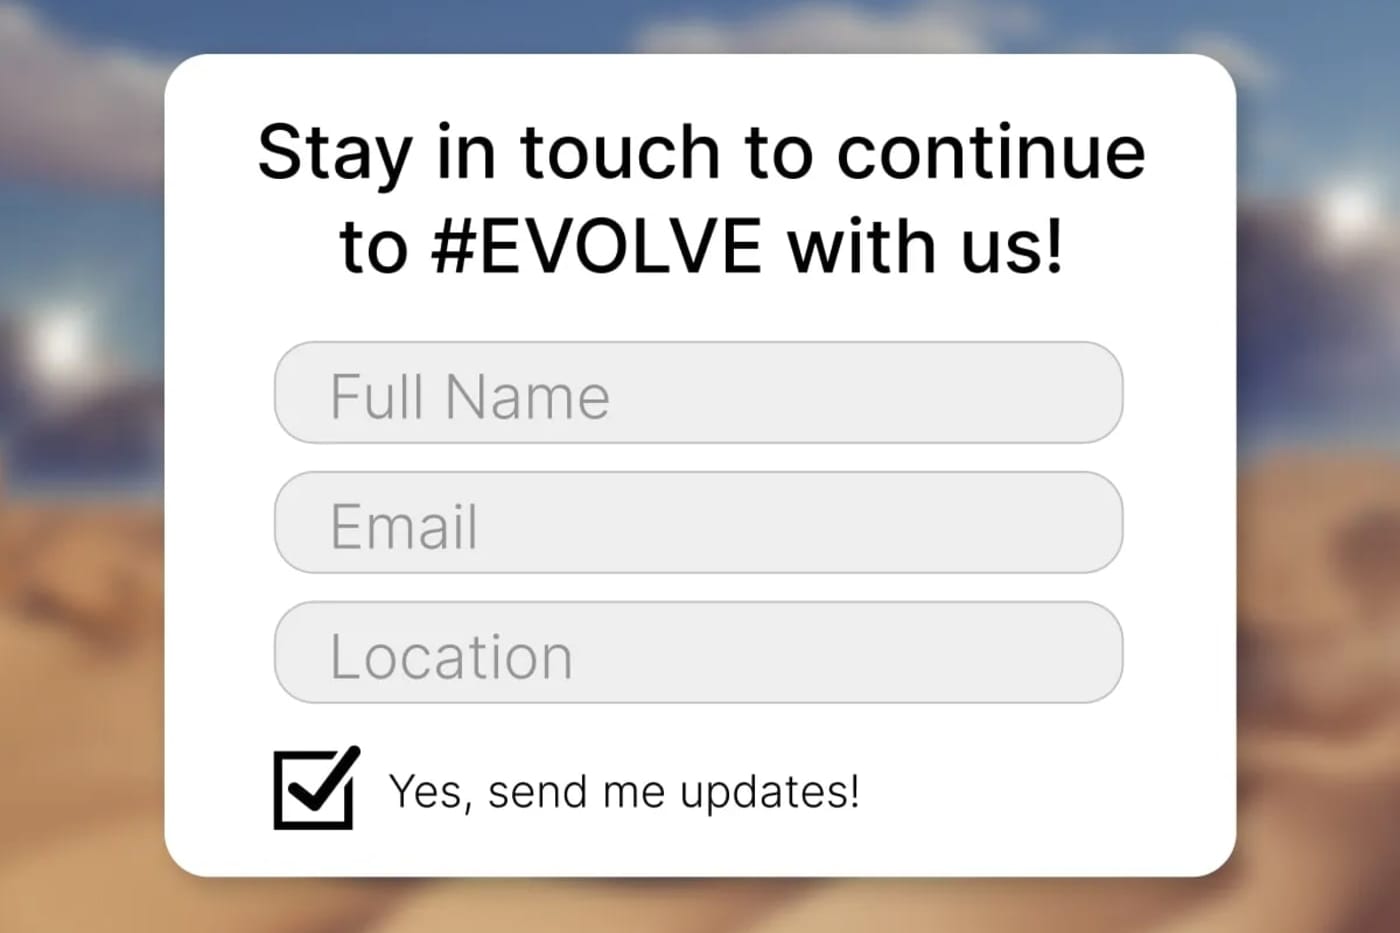
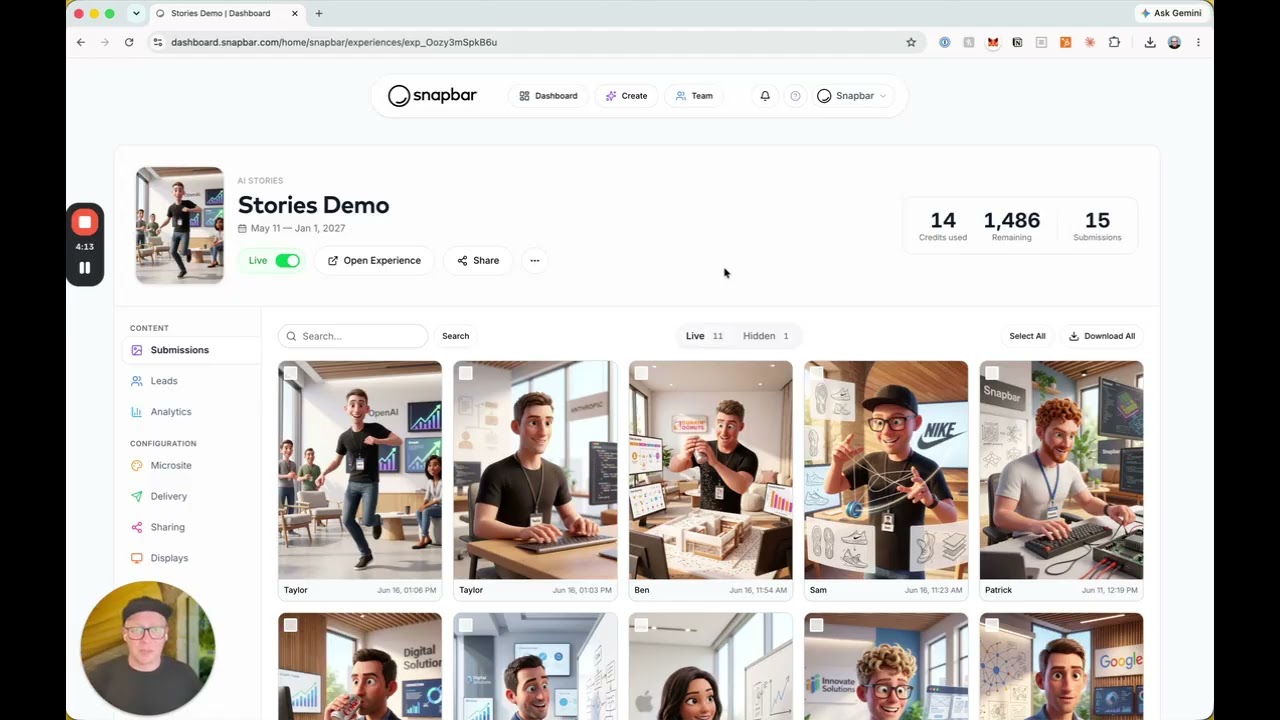
That design solves quality and quantity at once. When someone volunteers their information in exchange for something they actually want, the data is accurate and the consent is explicit. You also capture behavioral context: which experience they chose, what prompt they picked, whether they shared socially. All of it feeds lead scoring. And because the capture point is built in, the data exports cleanly as a structured file your team can load into any CRM or marketing automation tool, with each contact tagged by event, activation type, and timestamp. That tagging is what makes attribution a reporting filter instead of a research project. “Show me every deal that originated from our SXSW activation” becomes a query, not a guess.
This is the same principle behind effective event lead generation: the capture point and your downstream system have to be connected by design, from the start.
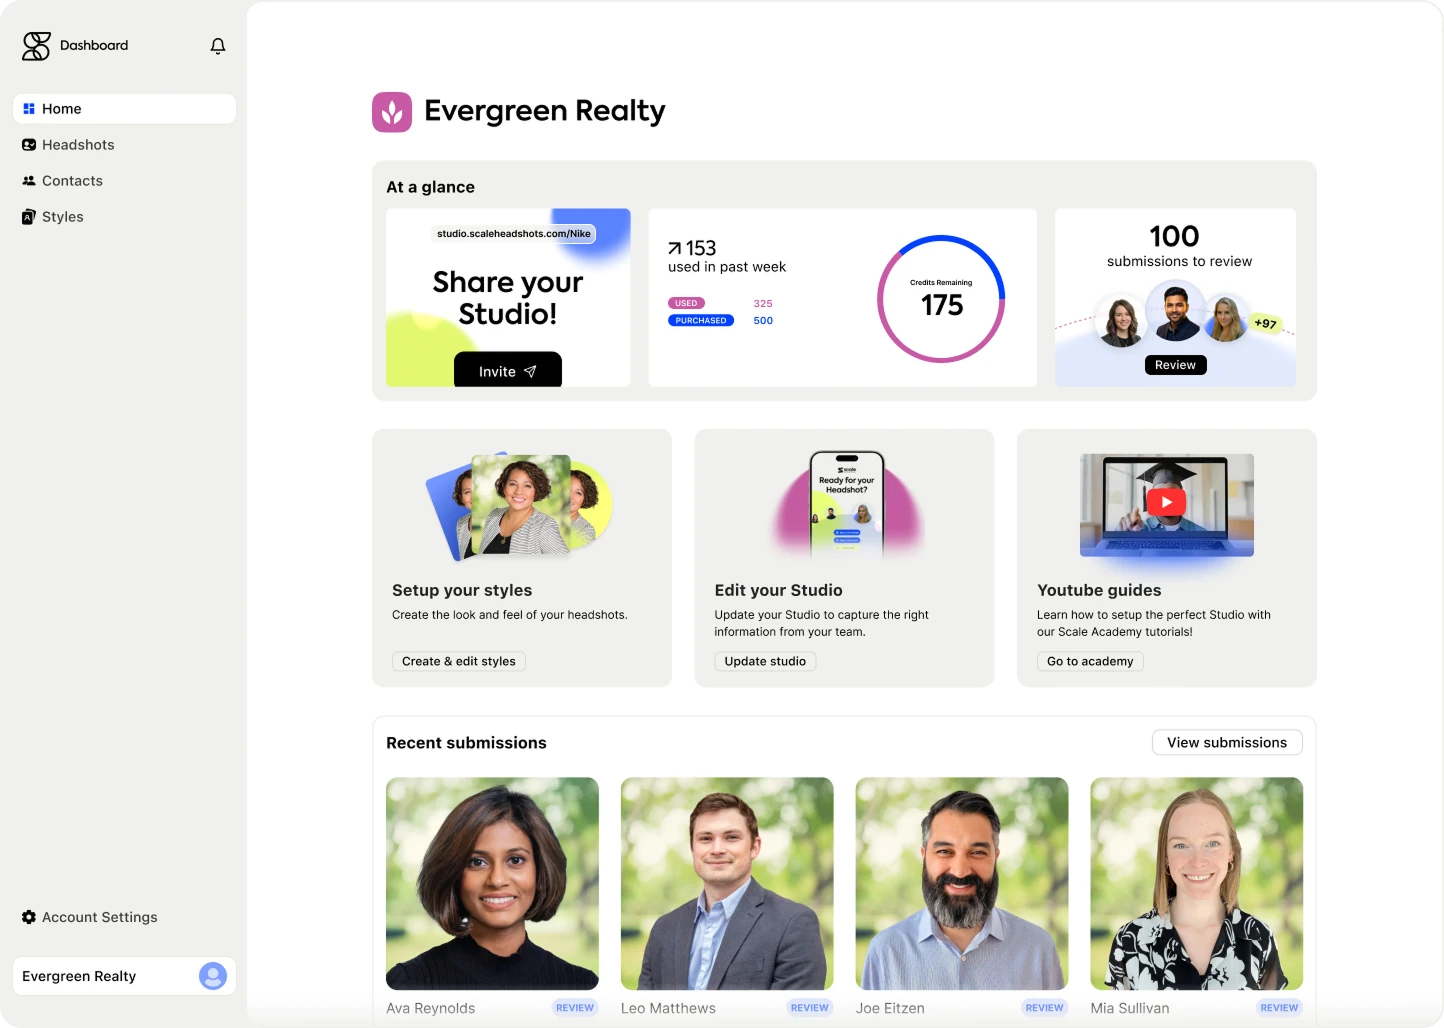
How Snapbar Builds Measurement Into the Experience
This is the problem we built our platform to solve. Every Snapbar activation, whether it is an experiential photo activation, an AI video moment, or an interactive game, captures engagement and lead data automatically as part of the guest experience. Built-in lead capture with custom data fields produces a clean, export-ready file after every activation, covering the Reach, Engagement, and Pipeline layers without a clipboard or a manual count in sight. Pair that with a post-experience survey for the Affinity layer, and you have all four covered before the event even starts.
For agencies, that means a faster, richer post-event report that makes the case for the next budget. For brands, it means a data asset that serves marketing and proves its own worth to the board. The point is not the technology for its own sake. It is that the activation arrives measurement-ready, so the ROI conversation stops being a scramble and starts being your strongest argument.
Key Takeaways
Experiential's measurement problem is structural, not unsolvable: multiple objectives, passive data, and no standard framework. Fix it by measuring across four layers (Reach, Engagement, Affinity, Pipeline), with data capture as the thread that ties each one to a real outcome. Judge performance against published benchmarks first, then against your own historical trend line. Concentrate on the three metrics that connect a live moment to revenue: the marketing fuel multiplier, dwell time distribution, and first-party data capture efficiency. Above all, design measurement into the activation before it runs, because the teams that build capture in from the start are the ones who keep their budget. For the formulas behind the Pipeline layer, see our guide on how to measure event activation ROI.