Table of Contents
Experiential marketing has moved from a “nice to have” line item to one of the most accountable channels in the mix, because it now produces data. The problem with most experiential statistics floating around online is that they are wrong. Numbers get rounded up, misattributed, and stitched together as they pass from one blog to the next. We went back to the primary sources. Every figure below is labeled either verified (traced to the original research, with a link) or industry estimate (a real but widely repeated benchmark with no single primary study). The fabricated and misattributed stats that fill competitor roundups were left out on purpose.
Key takeaways
- Global experiential spend hit a record $128.35 billion in 2024, finally passing pre-pandemic levels (PQ Media).
- 84% of consumer marketers and 86% of B2B marketers plan to increase event spending in 2026 (EventTrack 2026).
- 98% of attendees said a live experience made them more inclined to purchase, when the product was one they cared about (EventTrack).
- 98% of consumers create digital or social content at events, and effectively all of them share it (EventTrack).
- The immersive events and experiential segment is projected to grow from $1.9B to $9.3B by 2030, a 31.4% CAGR (Grand View Research).
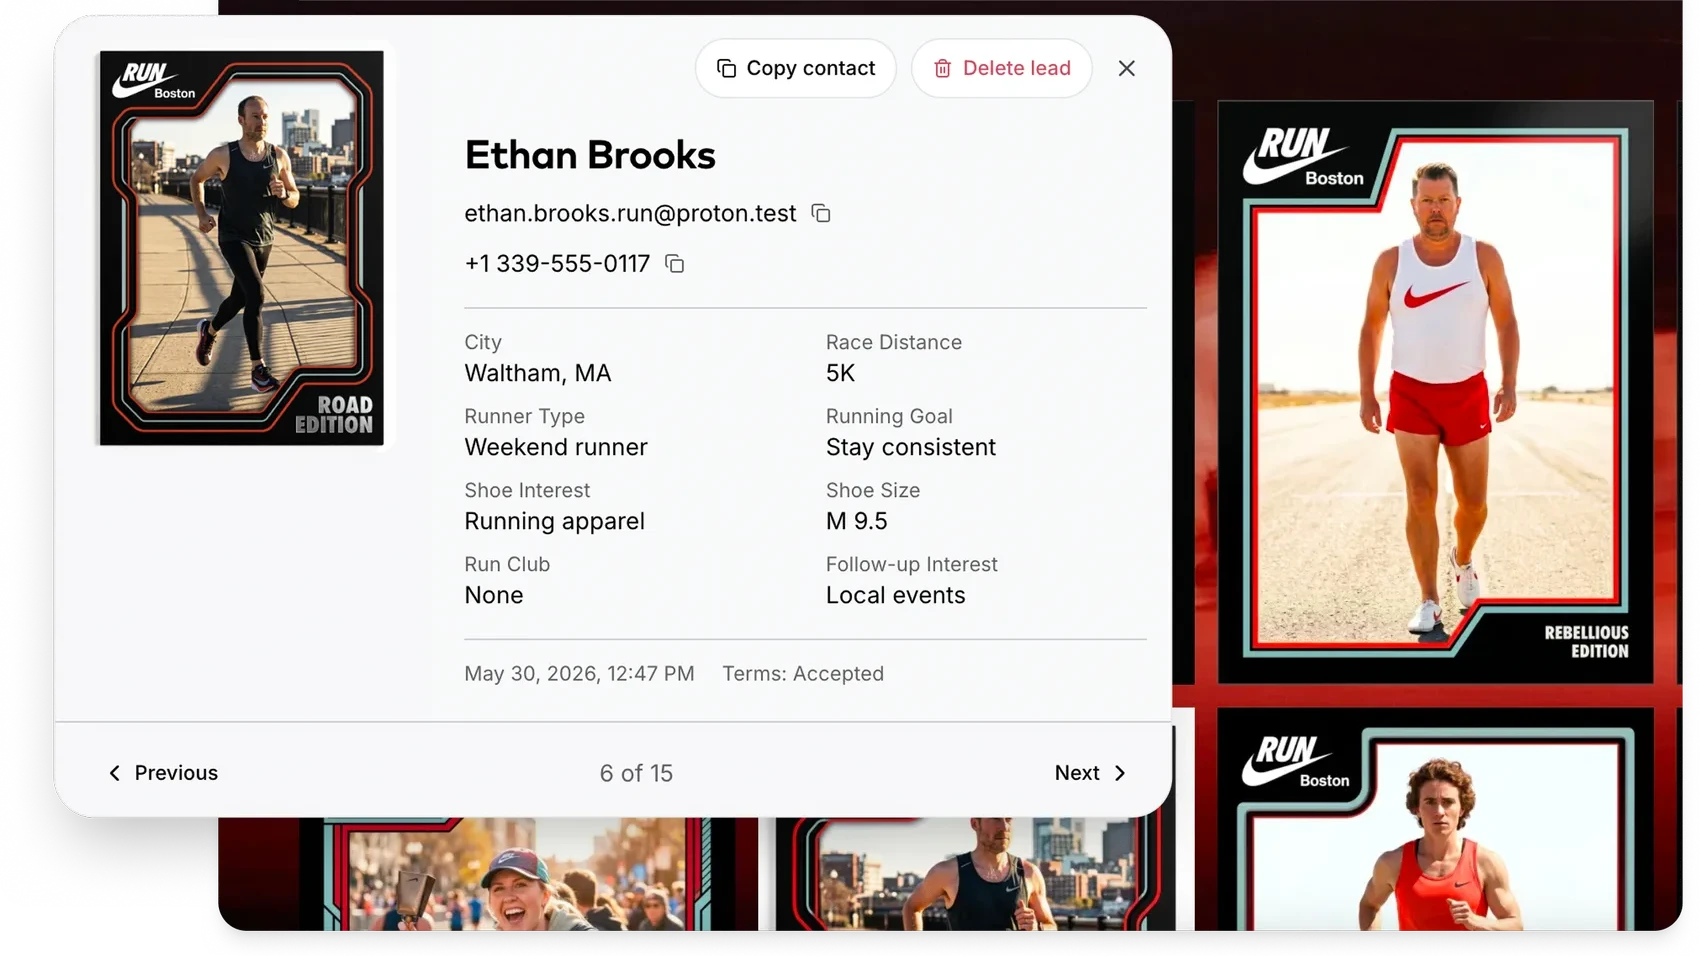
- Leads and data capture are now the top success metric for consumer events, ahead of foot traffic (EventTrack 2026).
How We Sourced These Numbers
Most experiential statistics roundups copy each other. We traced each figure to its origin and kept only what holds up. Two labels appear throughout:
- Verified means the number traces to the organization that actually produced it (PQ Media, Grand View Research, the EventTrack report series, Eventbrite), with a source you can check.
- Industry estimate means the figure is real and widely used, but circulates as a benchmark without a single primary study behind it. Useful directionally, cited honestly.
Where a commonly repeated stat turned out to be misquoted or misattributed, we corrected it to the real number or left it out. That is the difference between a page that gets cited and a page that spreads errors.
Market Size and Growth
Experiential is one of the few channels growing in absolute spend. As third-party tracking degrades and consumers tune out static ads, brands keep reallocating budget toward live moments they can measure.
| Metric | Figure | Source |
|---|---|---|
| Record global experiential spend (2024) | $128.35B, up 10.5% year over year, passing the $121.87B spent in 2019 | Verified, PQ Media |
| B2C experiential spend (2024) | $90.32B, up 10.3% year over year | Verified, PQ Media |
| B2B experiential spend (2024) | $38.03B, up 11.1% year over year | Verified, PQ Media |
| Immersive events and experiential segment | $1.9B (2024), projected to $9.3B by 2030 (CAGR 31.4%) | Verified, Grand View Research |
| Experiential marketing services market | $55.53B (2026), projected to $71.22B by 2035 (CAGR 3.16%) | Industry estimate, syndicated market research; note this tracks the agency/services market, a narrower scope |
A note on the spend figures: PQ Media's $128.35B is a forecast issued in late 2024, and the B2C ($90.32B) and B2B ($38.03B) numbers sum to it cleanly. Treat them as the most credible spend benchmark available. Market-size projections from syndicated research firms vary widely by methodology, which is why we flag the services-market figure as an estimate.
Budgets and Investment Trends for 2026
Budget signals are the clearest read on confidence in a channel. The strongest data here comes from EventTrack, the annual benchmark study from Event Marketer surveying 1,000+ Fortune 1000 marketers and event attendees.
- 84% of consumer marketers will increase event spending in 2026, with about a third planning increases of 8 to 15%. (Verified, EventTrack 2026)
- 86% of B2B marketers will increase event spending in 2026, though 55% will hold the number of events flat and concentrate on higher-impact experiences. (Verified, EventTrack 2026)
- 74% of Fortune 1000 marketers planned to increase their experiential spend in 2025. (Verified, EventTrack 2025)
- In the UK, events were the fastest-growing marketing category in Q1 2026, recording a net balance of +14.7% (up from +1.4% the prior quarter), the standout line item in an otherwise cautious budget environment. (Verified, IPA Bellwether Q1 2026; net balance, UK only)
ROI and Effectiveness
This is the section budget-holders care about most. It is also where the most fabricated stats live, so it is shorter and cleaner than what you will find elsewhere. For a step-by-step framework on capturing these returns, see our guide on how to measure experiential marketing ROI.
- 98% of attendees said a live experience made them more inclined to purchase, when the product or service was one they were interested in. That qualifier matters and is usually dropped in other roundups. (Verified, EventTrack)
- 70% of attendees who buy once become repeat customers. (Verified, EventTrack)
- Leads and data collection is now the top success metric for consumer events, ahead of foot traffic and awareness, a clear sign the channel is being held to a revenue standard. (Verified, EventTrack 2026)
- Well-designed experiential campaigns are commonly cited as returning 3:1 to 5:1 on spend, with standout activations reaching higher. Treat this as a directional benchmark, not a measured average. (Industry estimate, no single primary study)
Consumer Behavior and Brand Perception
The through-line across the credible consumer research: a live experience changes behavior in ways a digital impression cannot.
- 74% of attendees left with a more positive opinion of the company, brand, or product after the event. (Verified, EventTrack)
- 96% of consumers who tell someone about an event mention the brand behind it, the word-of-mouth engine that makes experiential compound. (Verified, EventTrack)
- 3 in 4 Millennials would rather spend on an experience than on a desirable object, and 72% want to increase their spending on experiences. (Verified, Eventbrite/Harris)
Social, UGC, and Marketing Fuel
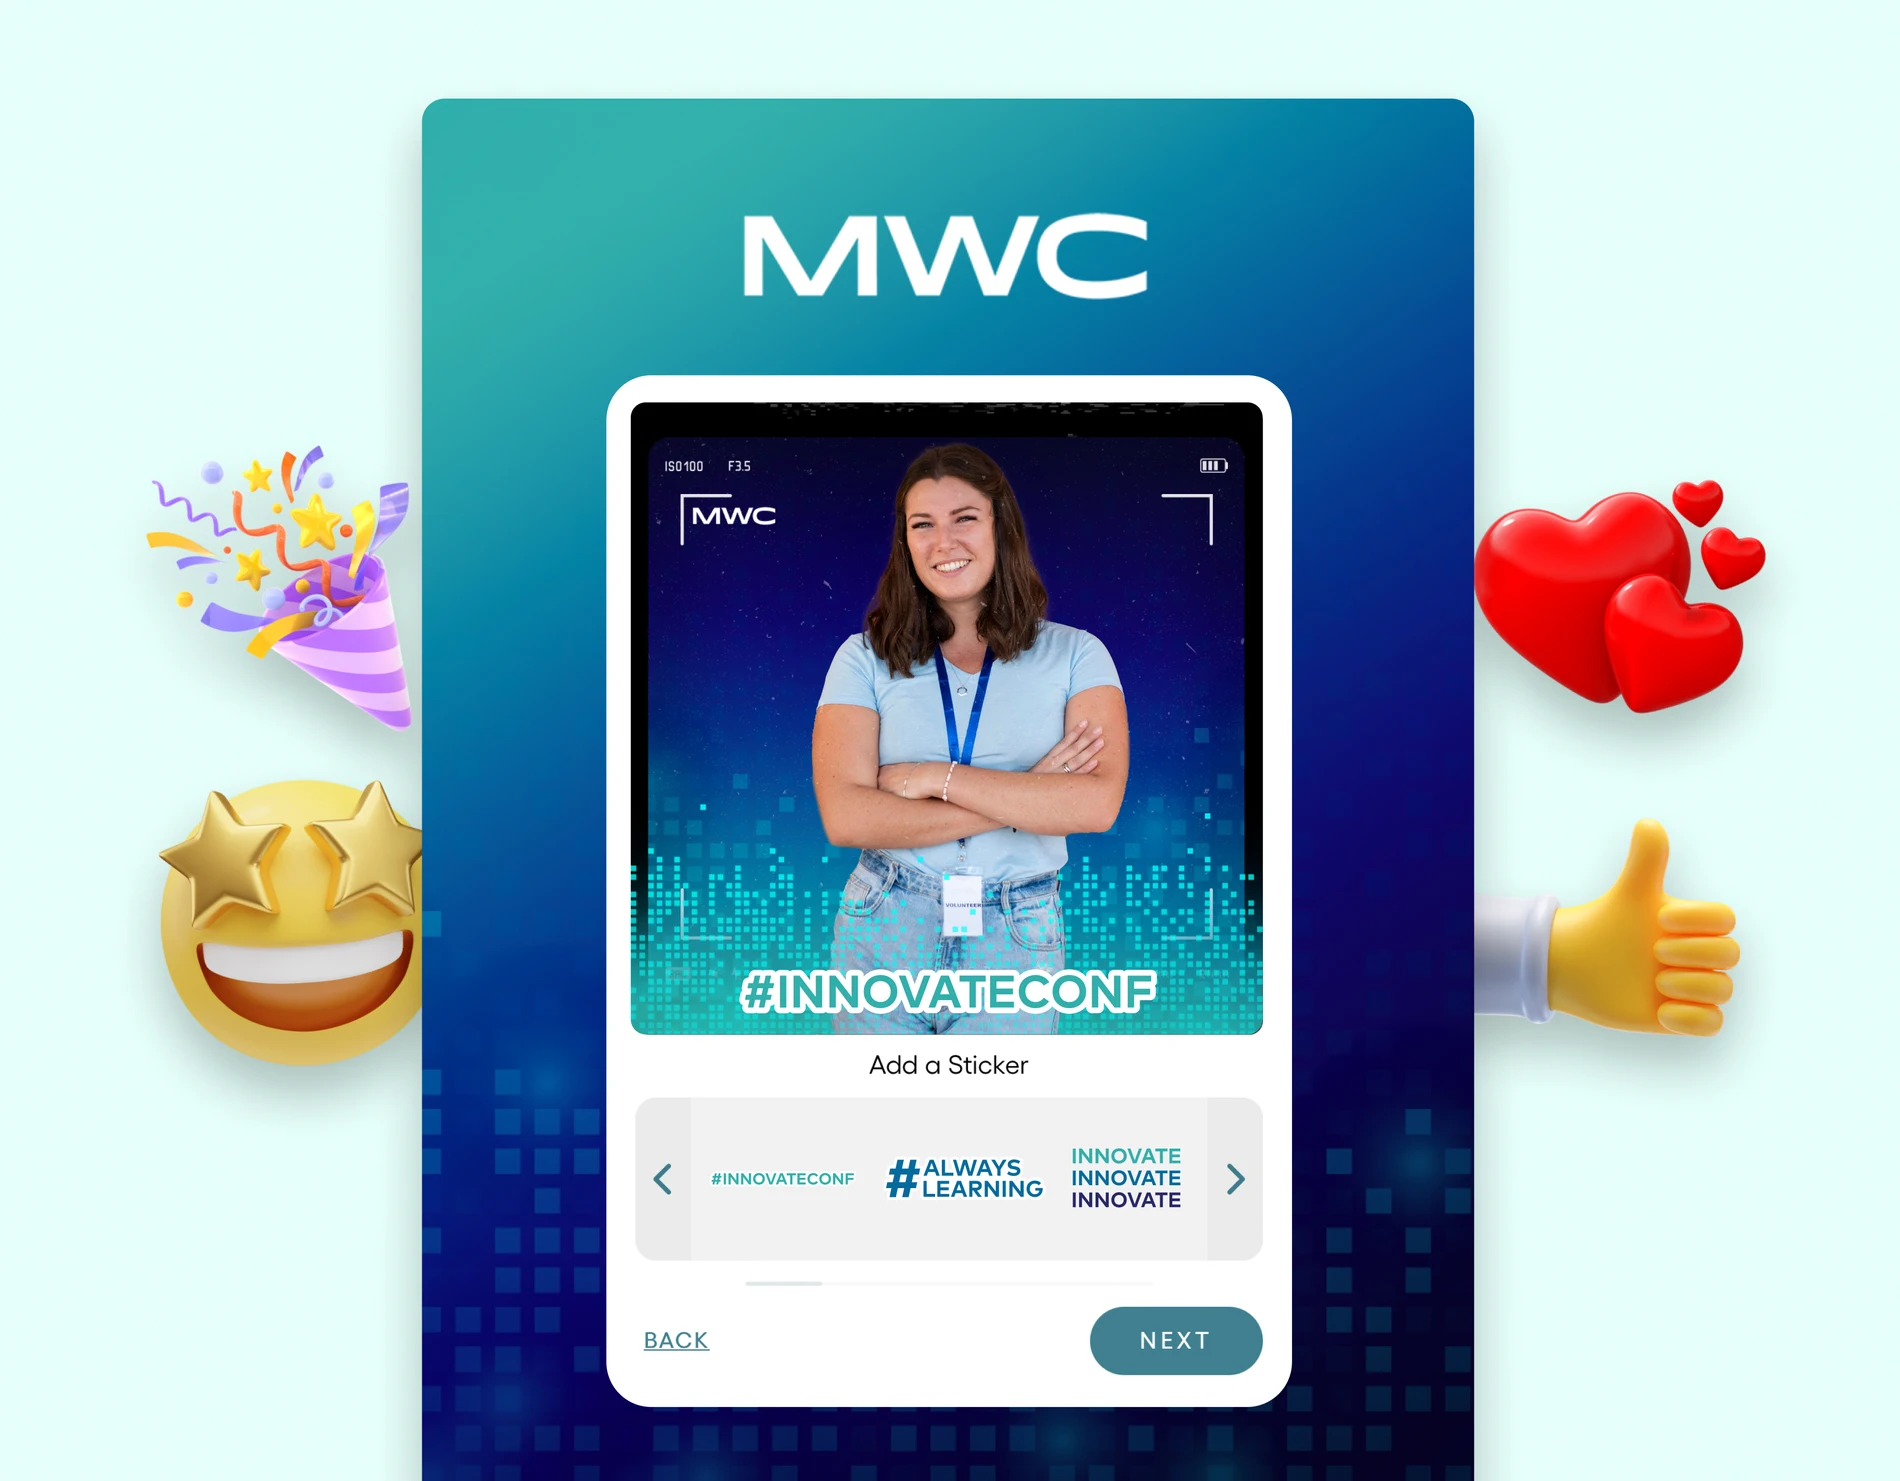
The content guests create is the amplification engine. Every shared moment is reach you did not pay for, which is why we call user-generated content from activations “marketing fuel.” Our deeper take is in how experiential activations generate marketing fuel.
- 98% of consumers create digital or social content at events and experiences, and effectively all of them share it online. This is the best-sourced UGC stat in the category. (Verified, EventTrack)
- User-generated content drives roughly 28% higher engagement than brand-produced content alone, when the two are mixed. (Industry estimate, attributed to comScore via secondary citations)
The Pattern Behind the Numbers
Across every credible dataset here, the through-line is the same. When an experience is worth participating in, guests willingly trade their contact information for content they want, and that first-party data becomes the most measurable asset of the campaign. That is the standard experiential is finally being held to, and it is the principle we build every activation around.
Methodology and Sources
Every statistic here was individually source-traced in June 2026, then labeled by how well it holds up.
- Verified figures come straight from the originating research: PQ Media (Global B2C and B2B Experiential Marketing Forecast, 2024 to 2028), Grand View Research (Immersive Marketing Market), the EventTrack series from Event Marketer (the 2015 and 2016 consumer and content studies and the 2026 benchmark), Eventbrite/Harris (experience economy), and the IPA Bellwether Report.
- Industry estimate figures are real, widely circulated benchmarks with no single primary study behind them; we frame them as directional.
- Excluded: several stats common to other roundups whose attributions did not hold up under checking. Market-size projections also vary by firm and methodology, so ranges reflect those differences.
Want activations built to produce numbers like these?
Let's TalkOr explore: How It Works | How to Measure Experiential Marketing ROI