Table of Contents
If you run experiential activations, you already know the awkward moment: the event is over, the photos looked great, the booth was packed, and then someone from finance asks, “So what was the return on that?” Measuring event activation ROI is now the top priority for 83% of marketing leaders, but only 36% feel they can actually do it with any precision. For experiential specifically, 39% of brands admit they still struggle to connect activations to business outcomes. The formulas are not the hard part. The hard part is designing measurement into the experience from the start, not bolting it on after the teardown.
This is the framework we use with our own clients and the one we recommend to any team running brand activations at scale. It covers the math, the metrics, the technology, and the reporting structure that turns “it felt like a success” into a number your CFO can work with. It is the tactical companion to our broader framework on how to measure experiential marketing ROI.
Why Event Activation ROI Is Hard to Measure (And Why It Doesn't Have to Be)
Event-level ROI is relatively straightforward when the event itself is the product: ticket revenue minus costs. But for brands using events as a marketing channel, the value creation happens downstream. A trade show activation generates leads that close three to six months later. A branded experience at a conference creates social content that drives awareness for weeks. An interactive activation captures email addresses that enter a nurture sequence and eventually convert.
Three things make this genuinely difficult:
Long sales cycles. In B2B, the average deal takes 60 to 90 days to close. Some take over a year. By the time a trade show lead becomes a customer, the event budget has been spent and the next fiscal year has started. Traditional ROI calculations that only count revenue “from” the event miss most of the actual return.
Multi-touch journeys. That lead who scanned a QR code at your activation probably also visited your website, read two blog posts, and watched a demo video before requesting a quote. Attributing the deal entirely to the event is inaccurate. Ignoring the event's contribution is worse.
Intangible brand value. When 500 people share branded photos from your activation, the reach is real but the revenue is indirect. Earned media has value. Social proof has value. Brand recall has value. The challenge is assigning credible numbers to these outcomes without inflating them.
None of these are unsolvable. They just require a different approach than counting cash at the register. The rest of this article gives you the specific formulas, metrics, and technology setup to handle all three.

How to Measure Event Activation ROI
Event activation ROI measures the financial return generated by a specific activation (a branded experience, interactive installation, or engagement touchpoint) relative to its cost. The core formula is the same one used across all marketing: subtract your costs from your returns, divide by your costs, and multiply by 100 to get a percentage.
ROI (%) = [(Revenue Generated - Activation Cost) / Activation Cost] x 100
If you spent $15,000 on a trade show activation and it generated $75,000 in attributable pipeline that closed, your ROI is 400%. Straightforward when the numbers are clean.
The practical challenge is defining “revenue generated” for activations where the primary output is leads, not immediate sales. This is where Value Per Lead (VPL) becomes essential.
Calculating Value Per Lead
VPL converts a lead count into a projected revenue figure you can use before deals actually close. You need two numbers from your existing sales data:
VPL = Average Deal Size x Lead-to-Customer Conversion Rate
If your average deal is $8,000 and 12% of your qualified leads convert, your VPL is $960. Now you can calculate projected ROI immediately after the event:
Projected Revenue = Number of Qualified Leads x VPL
Generate 150 qualified leads at a $20,000 activation? That is $144,000 in projected revenue, a 620% projected ROI. This number will be validated (or adjusted) as those leads move through your pipeline, but it gives you a credible early figure for budget conversations and post-event reporting.
The Pipeline Attribution Multiple
For teams that track pipeline value in their CRM, there is an even simpler metric: the pipeline multiple.
Pipeline Multiple = Total Pipeline Value Influenced / Total Activation Cost
If your $20,000 activation influenced $200,000 in qualified pipeline, you are looking at a 10:1 multiple. This is the metric that resonates most with sales leadership because it speaks directly to revenue potential without requiring every deal to close first.
Going Deeper with Customer Lifetime Value
VPL captures the initial deal. Customer Lifetime Value (CLV) captures the full relationship. If your average customer stays for four years at $8,000 annually, your CLV is $32,000. Twenty converted customers from a single event represent $640,000 in lifetime value, not just $160,000 in first-year revenue.
CLV is particularly relevant for experiential activations because event-sourced customers tend to have higher retention rates. They met your team, experienced your product firsthand, and had a positive emotional interaction with your brand. That matters for long-term value in a way that a cold inbound lead cannot replicate.
What Metrics Should You Track for Event Activation ROI?
Not every metric matters equally, and tracking everything is a recipe for analysis paralysis. The metrics that matter map to where they sit in your marketing funnel. Here is the framework we recommend:
Awareness metrics tell you how far your activation's reach extended beyond the event floor. Track social media impressions and reach from event-related content, the volume of user-generated content (branded photos, videos, social shares), earned media value (what you would have paid for equivalent ad impressions), and website traffic spikes during and immediately after the event.
Consideration metrics tell you whether that awareness translated into interest. Track the number of qualified leads captured at the activation, demo requests or meeting bookings sourced from event contacts, content engagement from event leads (email opens, page visits, resource downloads), and cost per lead compared to other channels.
Decision metrics tell you whether interest became revenue. Track deals closed within your attribution window, average deal size for event-sourced leads versus other sources, sales cycle length for event leads versus cold leads, and the pipeline multiple for the activation.
The specific metrics you prioritize depend on your activation's primary objective. A brand awareness activation at a music festival will weight the first category heavily. A lead generation activation at a trade show will focus on the second and third. Define your primary and secondary objectives before the event, and align your measurement plan to those objectives.
How Event Technology Turns Activations into Data Engines
The formulas above are only useful if you have clean data to plug into them. This is where most measurement plans fall apart: the activation was engaging, the crowd was great, but nobody set up a reliable way to capture and connect the data.
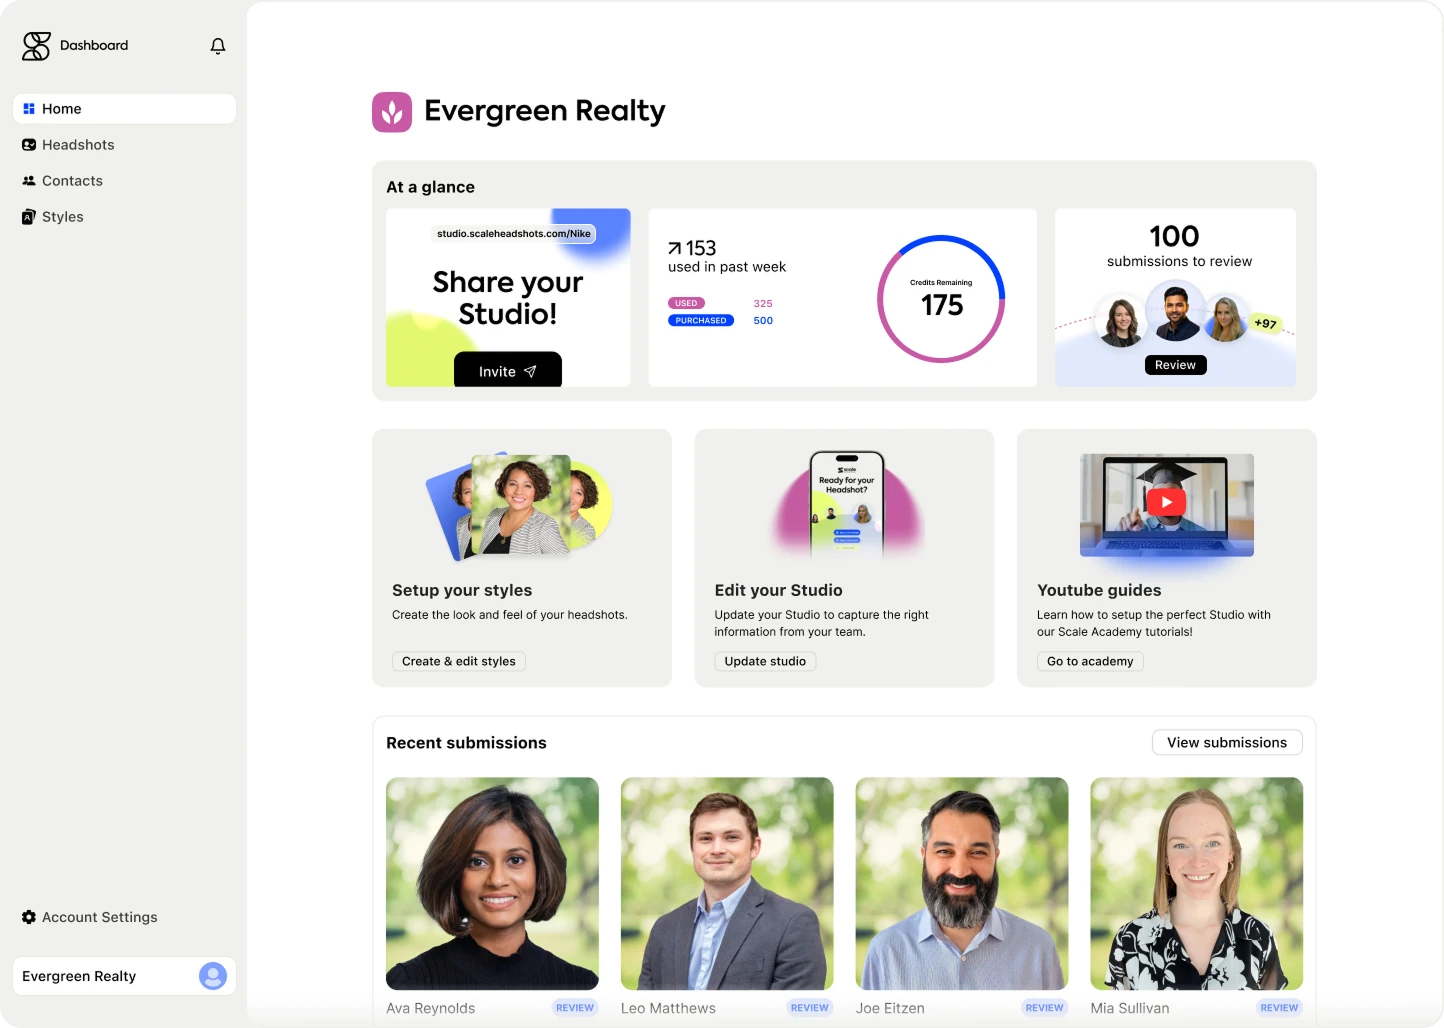
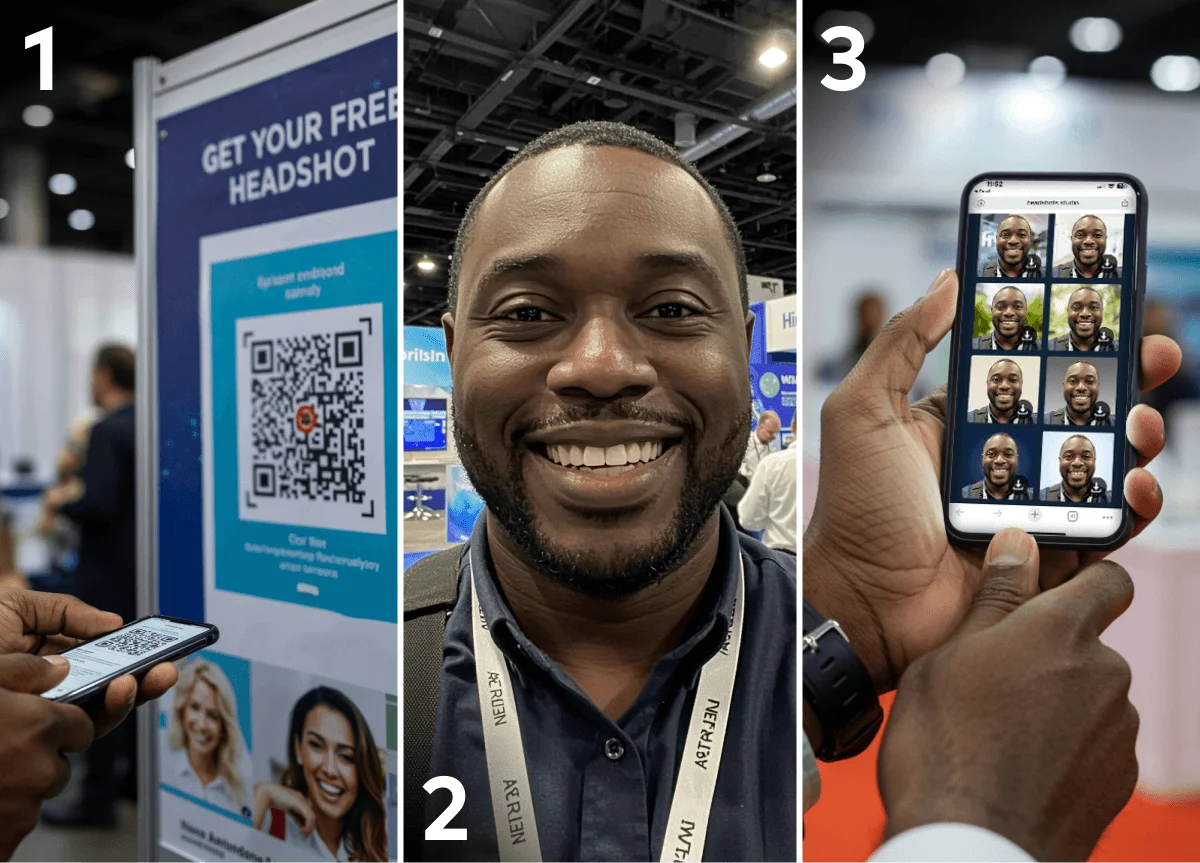
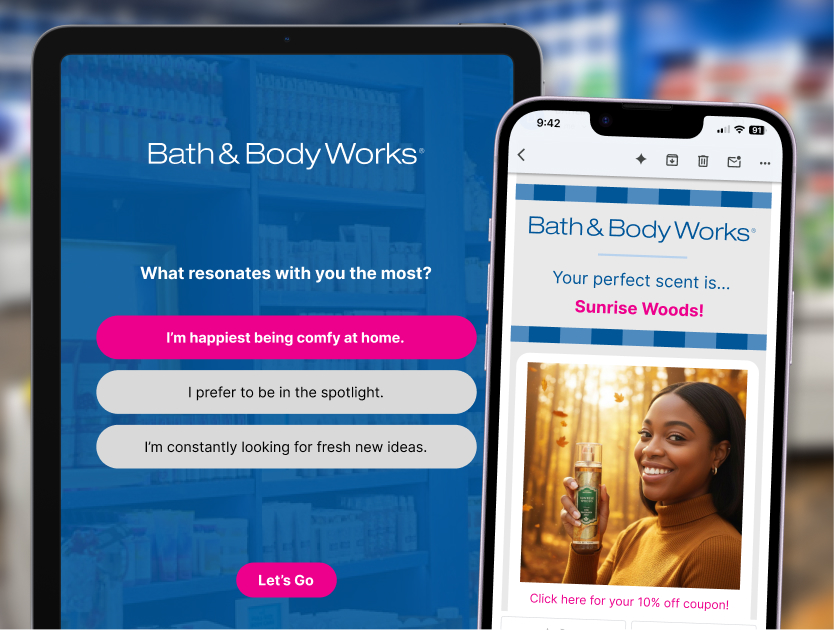
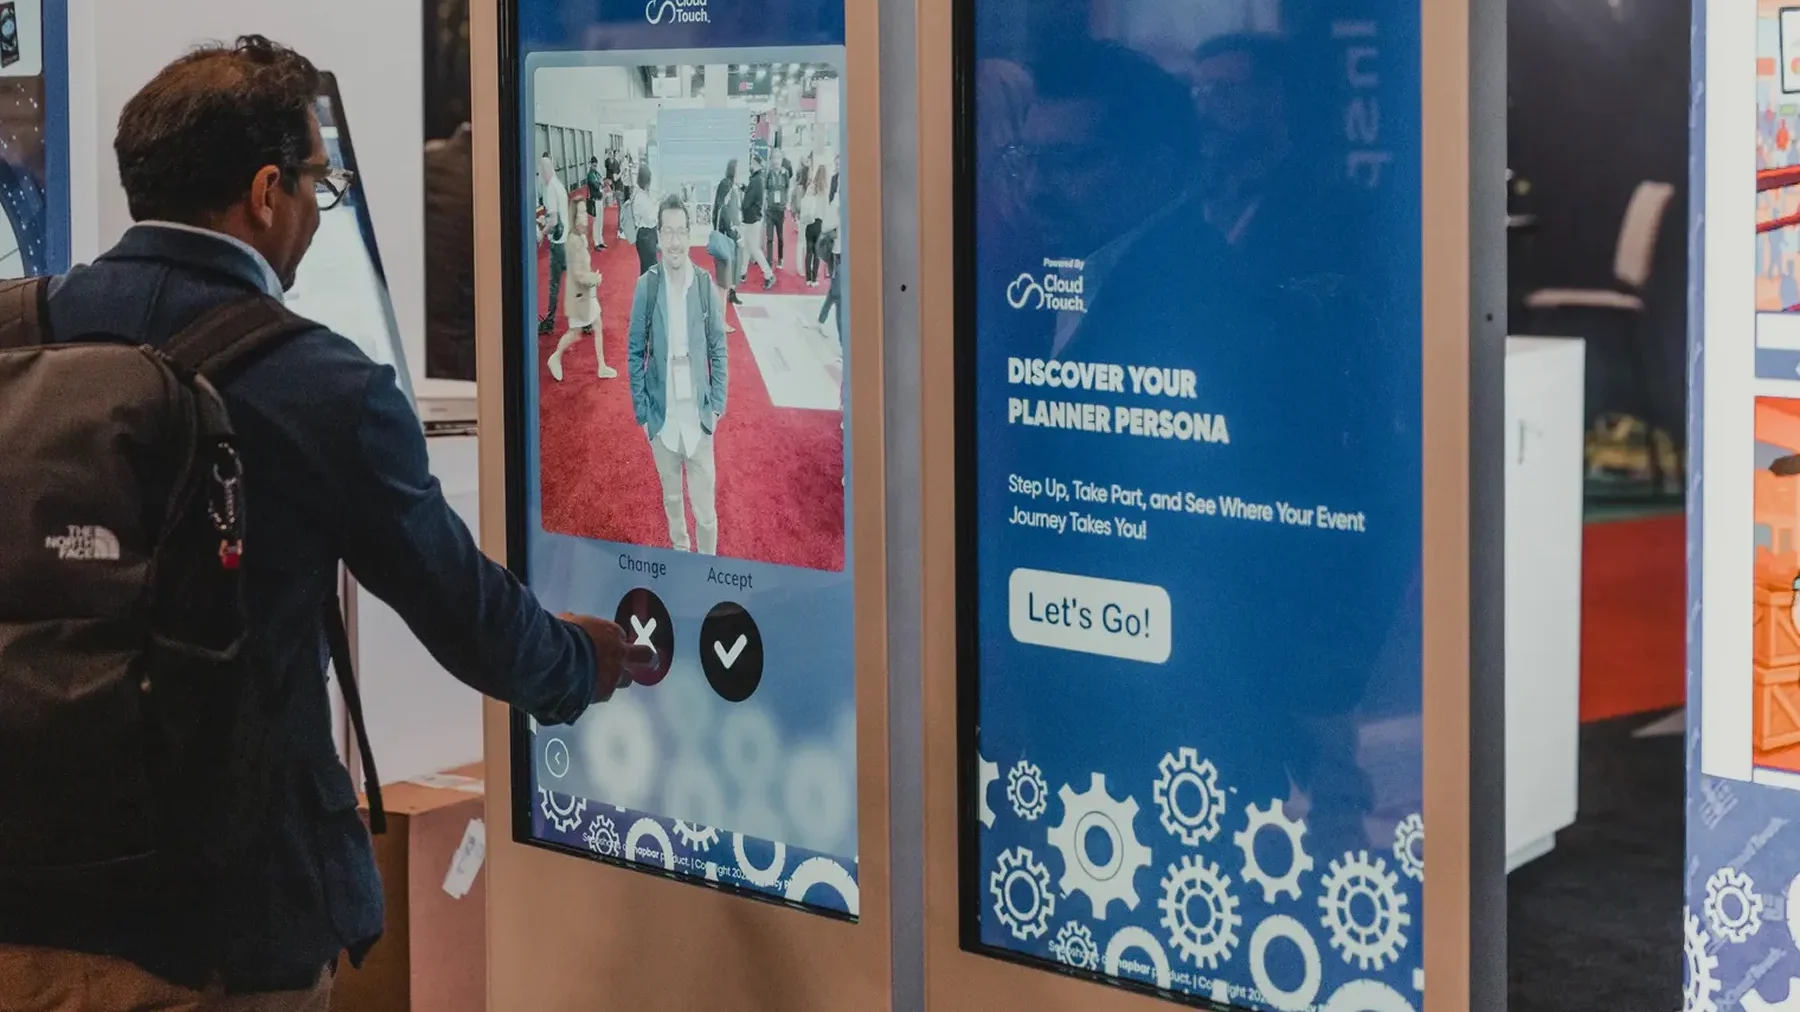
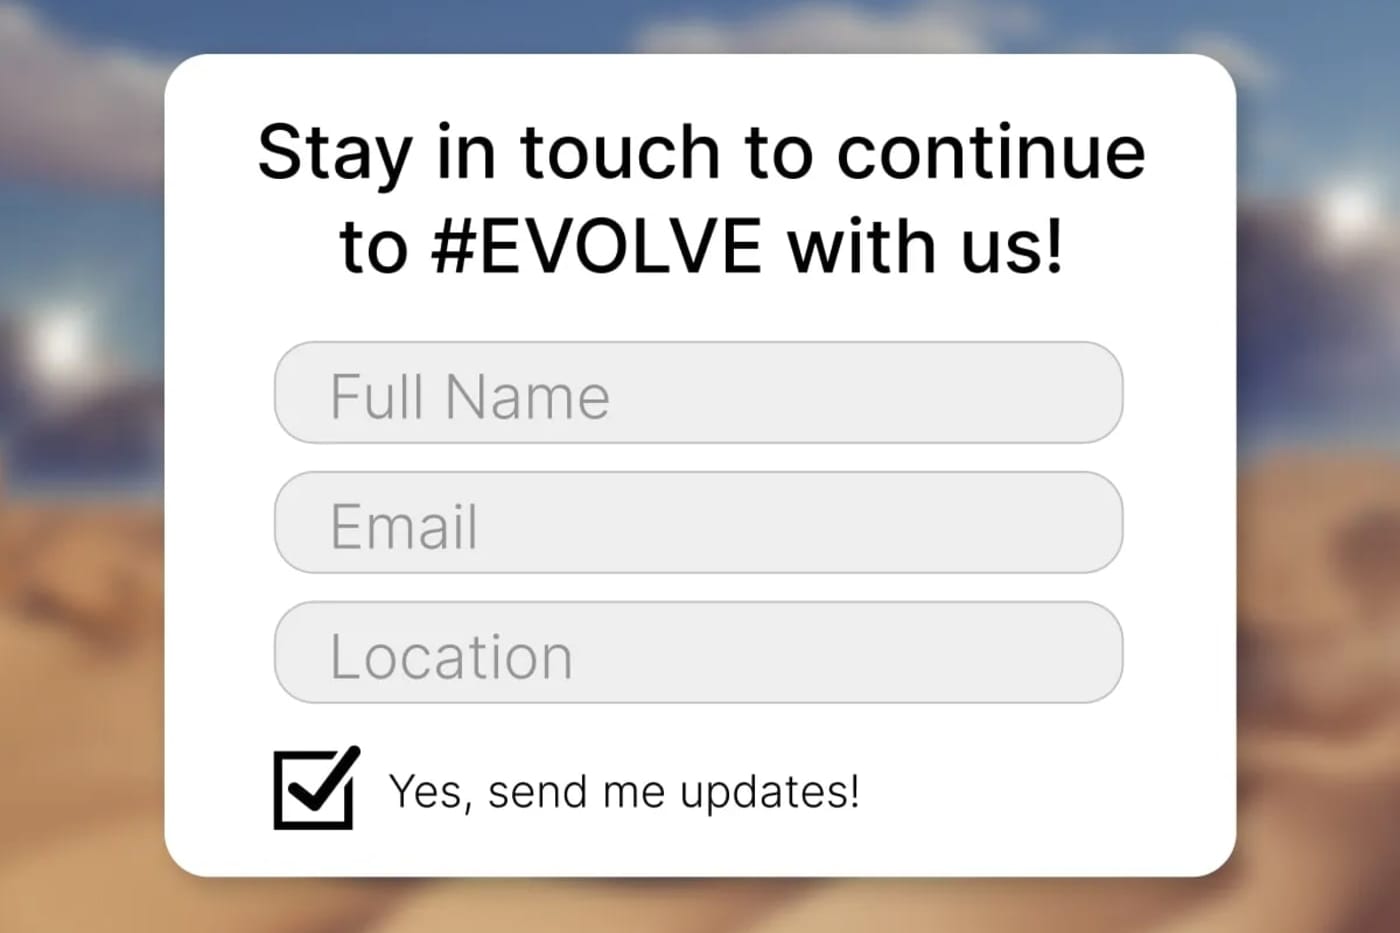
The most effective approach we have seen, and the one we built our platform around, is a natural value exchange: guests trade their contact info for content they actually want. Instead of asking people to fill out a form before they can participate, you create an experience that is valuable enough that people want to share their information to get the output. Someone takes a photo at your activation and enters their email to receive it. In the same flow, they can opt into your newsletter or answer a quick qualifying question. No clipboard. No awkward conversation. The data collection is embedded in the experience itself.
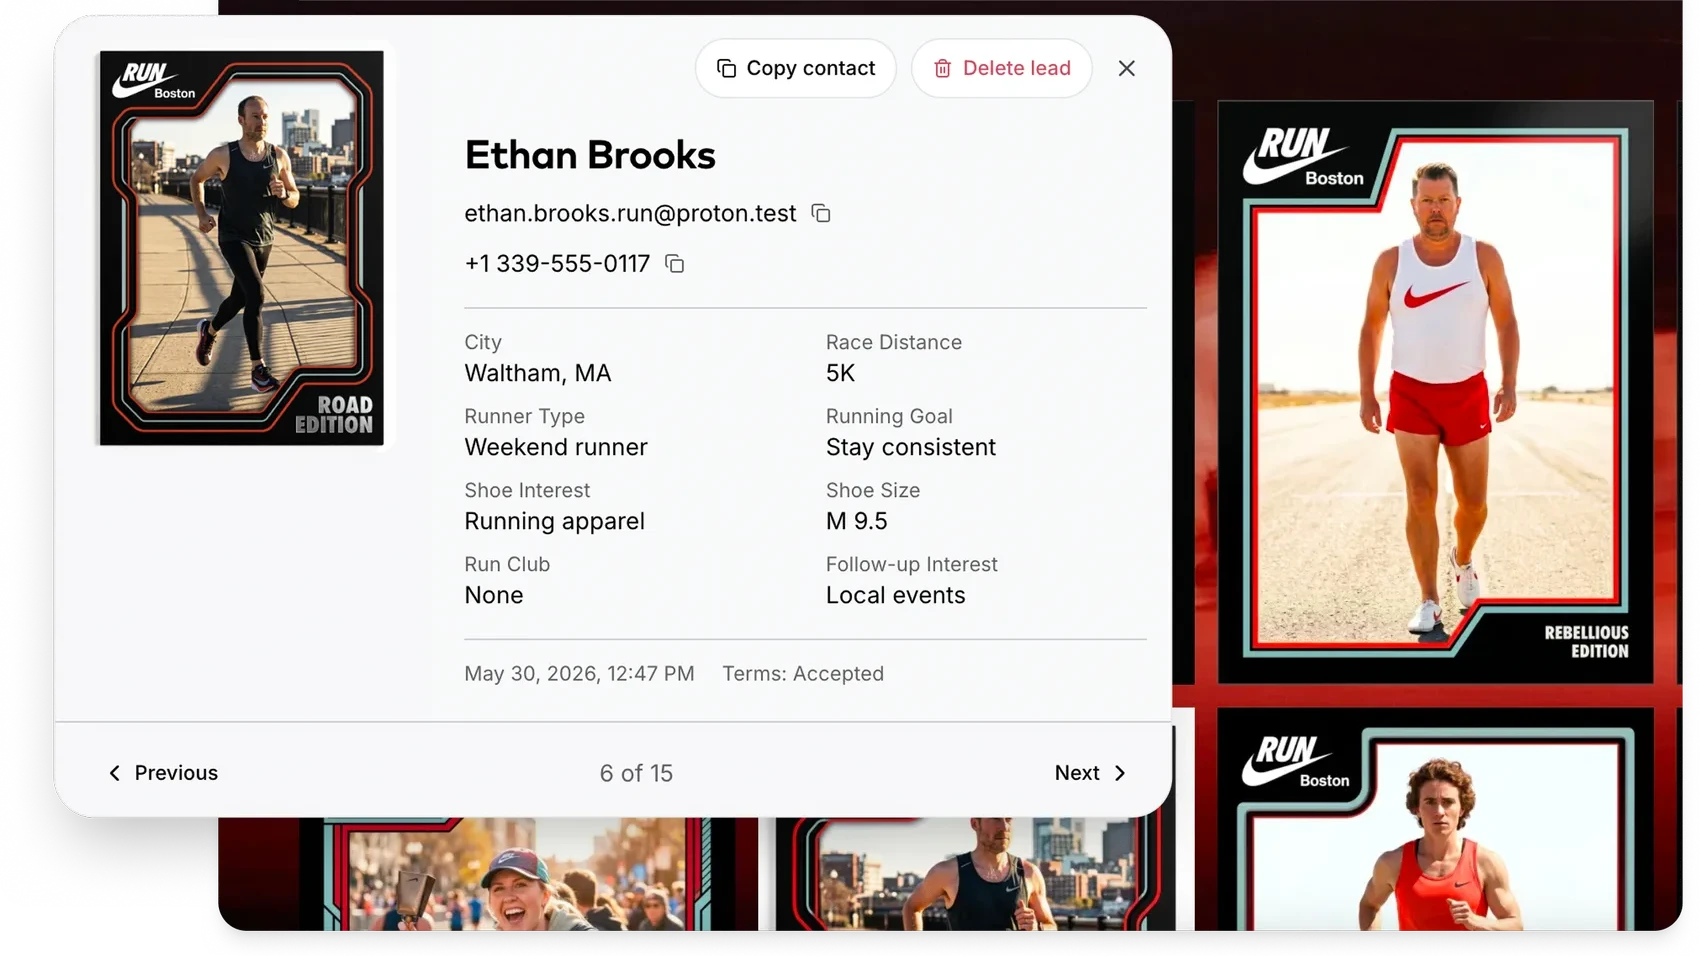
This approach solves the quality problem as well as the quantity problem. When someone voluntarily provides their information in exchange for something they actually want, the data is accurate (no fake emails) and the consent is explicit (no compliance issues). You also get behavioral context: which activation style they chose, what photo prompt they picked, and whether they shared their content socially. All of that feeds into lead scoring.
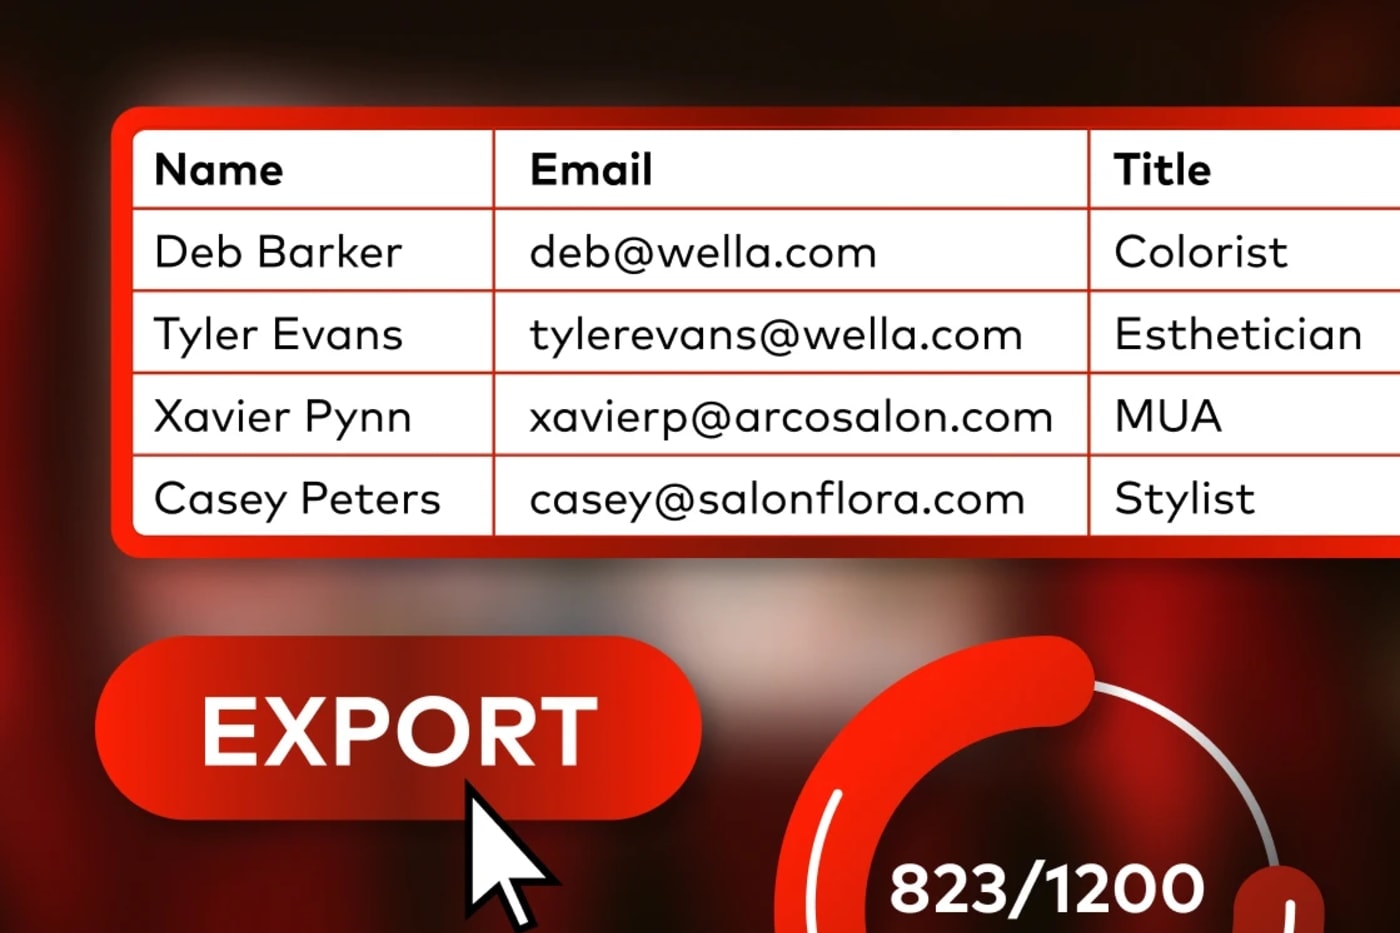
The second piece is integration. Captured data that lives in a spreadsheet on someone's laptop is functionally useless for ROI measurement. The activation's lead capture needs to connect directly to your CRM so every contact is tagged with the event name, activation type, and timestamp. That tagging is what enables closed-loop attribution: you can trace a specific lead from the moment they engaged with your activation through every touchpoint until they either converted or dropped off. This is the same principle behind effective event lead generation: the capture point and the CRM need to be connected from the start.
When your activation data flows into the same CRM your sales team uses, attribution becomes a reporting filter, not a research project. “Show me all deals that originated from our SXSW activation” becomes a query, not a guess.

How Long After an Event Should You Measure ROI?
Measuring event activation ROI is not a single calculation you run the Monday after the event. The full picture develops over months, and your measurement cadence should reflect that. We recommend four checkpoints:
30 days post-event: Capture engagement metrics (interactions, UGC volume, social reach) and initial lead counts. Calculate your projected ROI using VPL. This is your “early read” for internal reporting while the event is still fresh.
90 days post-event: Check pipeline progression. How many event leads became SQLs? What is the pipeline value influenced? This is typically when the first deals from event leads start closing, especially for mid-market sales cycles.
6 months post-event: Assess conversion rates for event-sourced leads versus other channels. This is where you start seeing whether the quality of event leads justifies the investment, not just the quantity.
12 months post-event: Calculate full ROI including all closed revenue and CLV projections. This is the complete number for annual planning and the one you use to benchmark against future events.
The 30-day number gets you budget approval for the next event. The 12-month number gets you a bigger budget. Both matter, and skipping either one leaves value on the table.
What Is a Good ROI for an Event?
The honest answer: it depends on what the event was designed to do. A 5:1 return (five dollars back for every dollar spent) is generally considered strong for event marketing. A 10:1 return is exceptional. But context matters more than benchmarks.
A brand launching in a new market might see a 2:1 return on their first event and that could be a strategic win if the primary objective was awareness and the leads are high-quality. A company running their tenth annual trade show activation should be expecting improvement over last year's numbers, whatever those were. (For a deeper look at how corporate event activation strategy connects to measurable outcomes, that guide covers the planning side of this equation.)
The most useful benchmark is your own historical data. Compare this event's cost per lead against your last event. Compare the pipeline multiple. Compare the conversion rate of event leads versus your other channels. If event leads convert at 15% while paid search leads convert at 3%, even a modest event ROI percentage might represent your most efficient acquisition channel.
One thing we see consistently: teams that design their activations with measurement built in from the start (integrated lead capture, CRM tagging, pre-defined KPIs) outperform teams that try to reconstruct the data after the fact. The ROI difference is not just in the math. It is in the intent.
Building a Post-Event ROI Report That Gets Budget Approved
Your ROI report is a sales pitch for your next event. It needs to tell a story that executives can follow, not just present a wall of numbers. Here is the structure that works:
Executive summary (one page). Lead with the headline ROI number, the total investment, and the projected revenue impact. If the number is strong, put it in the first sentence. If it is mixed, lead with the strongest metric (pipeline influenced, cost per lead, CLV) and frame the ROI number in context.
Goal performance scorecard. Show how you performed against each objective you defined before the event. Primary goal: “Generate 200 MQLs” with actual result: “217 MQLs (108% of target).” Secondary goals listed the same way. Visual progress bars or simple pass/fail indicators work better than paragraphs here.
Activation-level breakdown. If you ran multiple activations at the same event, compare their performance. Which activation generated the most leads per dollar? Which drove the most social shares? This granular view is what makes next year's activation strategy smarter.
Pipeline and revenue attribution. Show the current state of event-sourced leads in the pipeline. How many are in each stage? What is the total pipeline value? What has already closed? This is the section that finance cares about most.
Qualitative wins. Include the best UGC, standout social posts, and any notable attendee feedback. A gallery of branded photos from your activation showing real people enjoying the experience is more persuasive than another chart. This section adds the human context that makes the numbers feel real.
Recommendations for next time. What would you keep? What would you change? Specific, data-backed recommendations show that you are treating events as an iterating program, not a series of one-off expenses. This is what turns a report into a strategy document.
Key Takeaways
Event activation ROI measures the return from specific activations, not just the event overall. Use Value Per Lead and pipeline multiples to calculate projected ROI before deals close. Design data capture into the activation experience itself, do not bolt it on after. Measure at four checkpoints: 30 days, 90 days, 6 months, and 12 months. Benchmark against your own historical data, not industry averages. Your ROI report is a pitch for your next event budget; structure it accordingly.
Ready to build activations that prove their own ROI?
Let's TalkOr explore: Lead Capture | How It Works