Table of Contents
Here's the uncomfortable truth about events: most teams can't answer the question "was it worth it?" with any real confidence. They'll tell you attendance was strong, the booth looked great, and people seemed engaged. But when the CFO asks for numbers, the room goes quiet. Knowing how to measure event success is the gap between events that get funded again and events that get cut from next year's budget.
I spend most of my time thinking about this problem. As someone who sits between sales, marketing, and operations, I see how events generate pipeline, where leads fall through the cracks, and what data actually matters when you're justifying a six-figure event spend. The framework below is what I'd hand to any event marketer who wants to stop guessing and start proving ROI.
Why Is Measuring Event Success So Difficult?
Events sit at a frustrating intersection. They're expensive, highly visible, and notoriously hard to attribute. Unlike digital campaigns where you can track a click from ad to conversion, events involve physical spaces, human interactions, and long sales cycles that resist clean measurement.
Three things make it especially tricky:
Attribution gaps. A prospect visits your booth, has a great conversation, takes a follow-up meeting three weeks later, and closes four months after that. Did the event cause the deal? Or did it accelerate one that was already in motion? Most CRMs can't distinguish between the two without deliberate setup.
Vanity metrics masquerading as success. Foot traffic, badge scans, and "conversations had" feel good to report, but they tell you almost nothing about business impact. A booth that scans 500 badges and generates 3 opportunities performed worse than one that scanned 200 and generated 15. The second booth just looks less impressive in a recap deck.
Measurement as an afterthought. Too many teams build their measurement plan after the event, trying to reverse-engineer results from whatever data they happened to collect. By that point, the most valuable data points are already gone.
How Do You Define Success Metrics Before the Event?
The single most impactful thing you can do for event measurement is define what success looks like before you book the venue. This sounds obvious. Almost nobody does it rigorously.
Start by asking: what is this event supposed to accomplish? The answer should map to one of three categories.
Pipeline generation. You're there to find and qualify new prospects. Success metrics: number of qualified leads, cost per lead, meetings booked, and (eventually) pipeline value generated.
Pipeline acceleration. You're engaging existing prospects who are already in your funnel. Success metrics: stage progression rate for contacts who attended, time-to-close reduction, deal size compared to non-event-influenced deals.
Brand and awareness. You're building recognition in a market or launching something new. Success metrics: social reach, content created and shared, press mentions, direct traffic to your site during and after the event.
Most events serve more than one purpose, and that's fine. But rank them. If pipeline generation is the primary goal, don't let a great social media showing distract from a weak lead number. And if brand building is the point, don't beat yourself up over a low cost-per-lead.
Insight: The best event measurement frameworks separate three types of return: ROI (financial, revenue vs. cost), ROO (return on objectives, like leads captured or meetings booked), and ROE (return on emotion, like NPS and attendee satisfaction). Most teams only measure one. The complete picture requires all three.
What Engagement Metrics Should You Track?
Engagement metrics tell you whether people actually interacted with your presence or just walked by. They're the leading indicators that predict whether your pipeline and brand metrics will look good after the event.
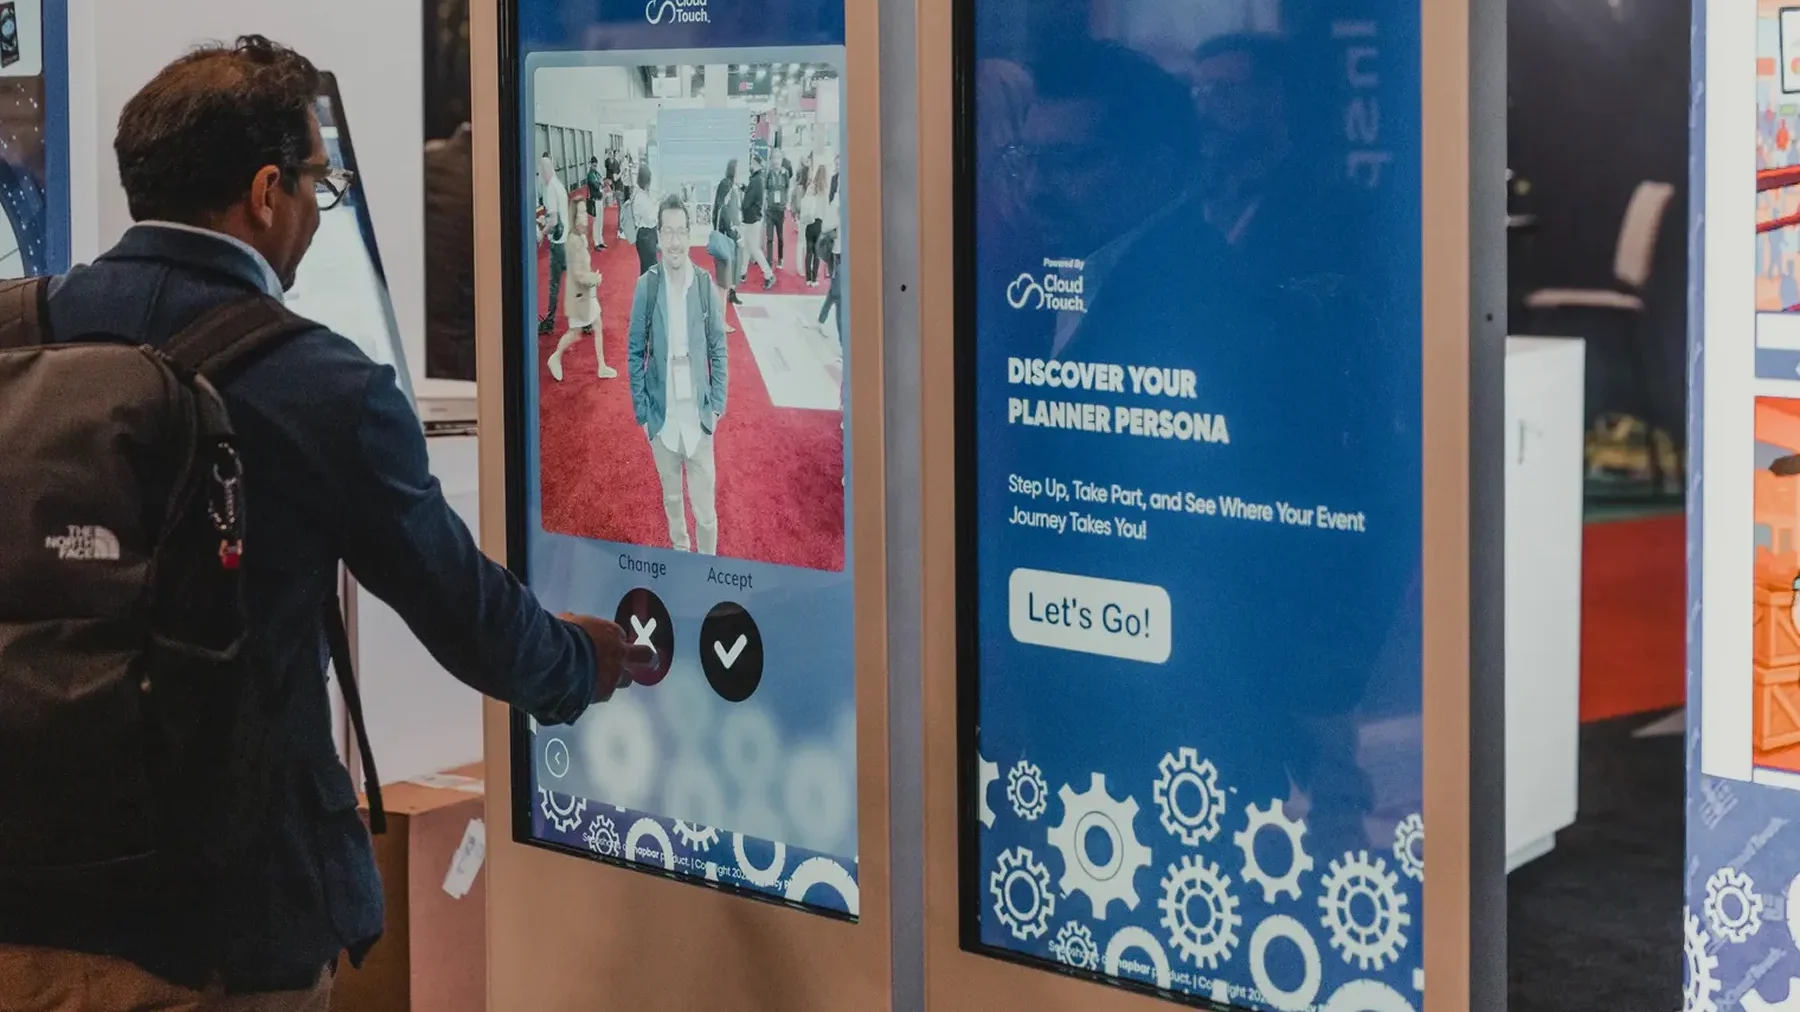
Participation rate. Of the people who could have engaged with your activation (total attendees, or booth visitors), what percentage actually did? A participation rate above 30% is solid for a trade show booth. AI-powered experiences and interactive activations tend to push this higher because the output itself is the incentive.
Dwell time. How long did people spend at your space? This matters more than headcount. Ten minutes of genuine interaction beats a 30-second badge scan every time. Activations that require participation naturally extend dwell time, which gives your team more conversation opportunities.
Content creation volume. If your activation generates personalized content (photos, videos, AI portraits, trading cards), the number of pieces created is a direct measure of meaningful engagement. This is different from badge scans because content creation requires active participation, not just proximity.
Repeat engagement. Did attendees come back for a second interaction? At multi-day events, repeat visits signal genuine interest rather than passing curiosity. Track unique versus total interactions to understand this.
How Do You Measure Lead Quality From Events?
This is where measurement gets serious. Lead volume is easy to count. Lead quality is what determines whether your event budget actually produced revenue.
Cost per lead (CPL). Total event cost (booth, travel, activation, staffing, sponsorship) divided by total leads captured. Compare this against your other channels. If your event CPL is $150 and your paid search CPL is $90, that's not necessarily bad, but you need to prove the event leads convert at a higher rate to justify the premium.
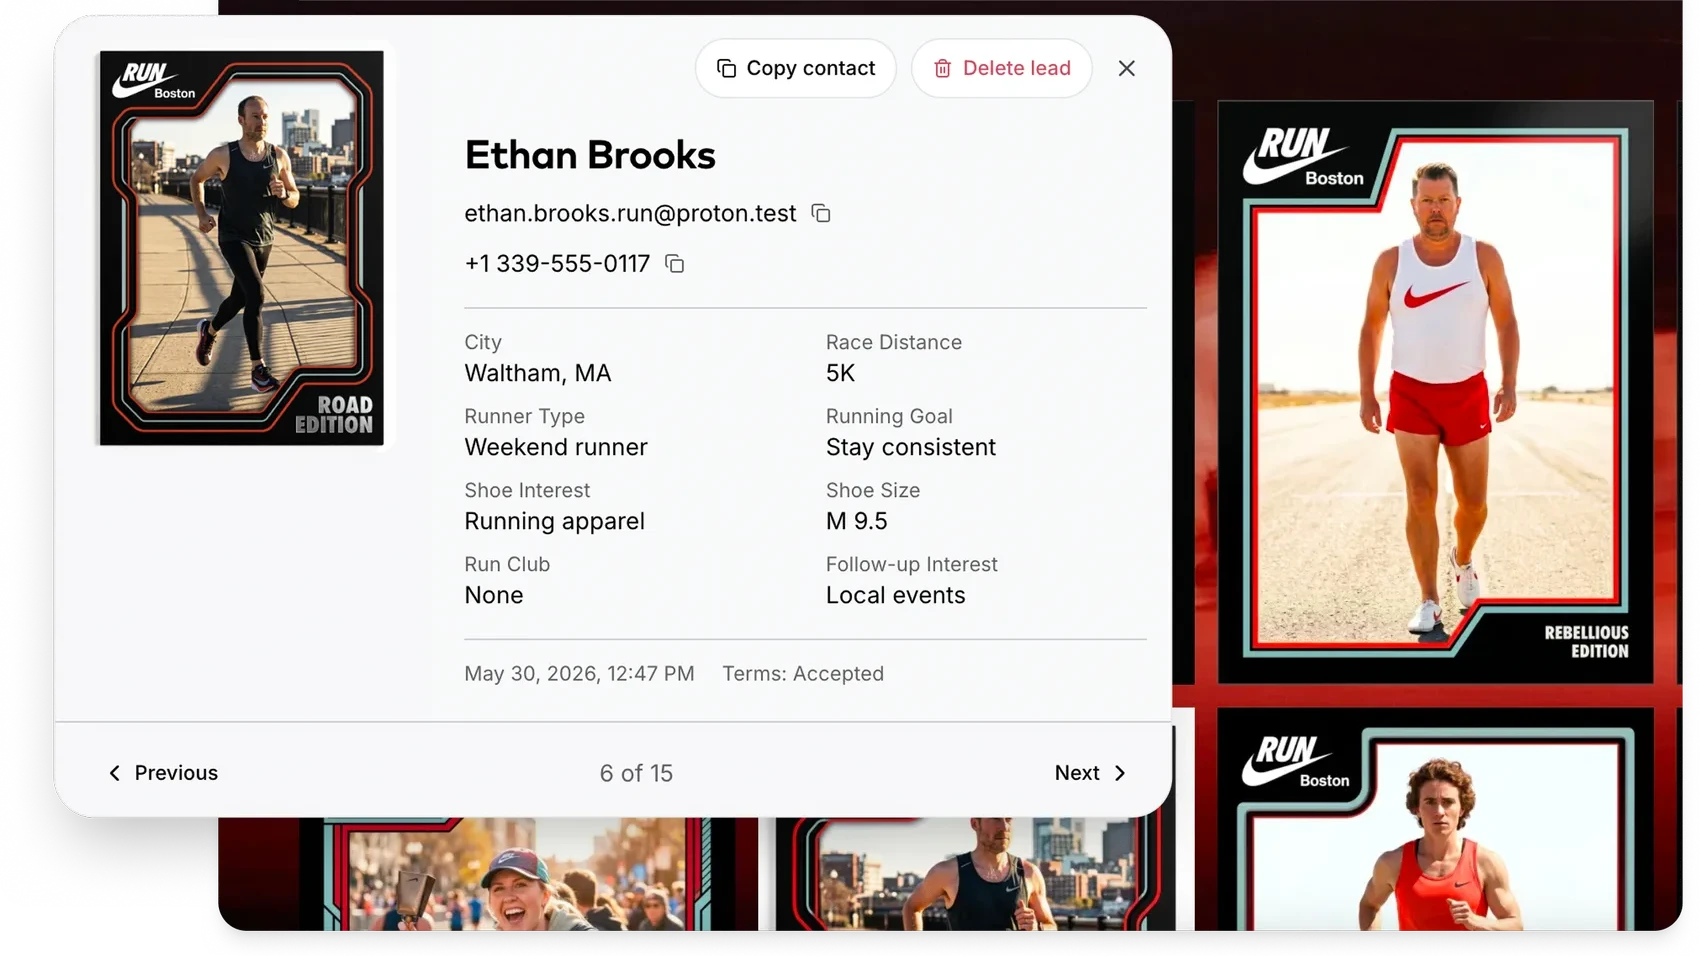
Lead-to-opportunity rate. What percentage of event leads become qualified opportunities in your pipeline? This is the metric that separates badge-scan leads from real prospects. If you're using a lead capture approach that collects context (not just name and email, but what the person is interested in, their timeline, their role), your lead-to-opportunity rate will be significantly higher because sales has something to work with in follow-up.
Lead-to-close rate and average deal size. The ultimate test. Track event-sourced deals separately in your CRM and compare close rates and deal sizes against other sources. In many B2B organizations, event-influenced deals close at a higher rate and at a larger size because the in-person interaction builds trust that digital touches can't replicate.
Speed to follow-up. This isn't technically a lead quality metric, but it directly affects every metric above. Leads contacted within 24 hours of an event convert at dramatically higher rates than those contacted a week later. Measure it, and hold your team to it.
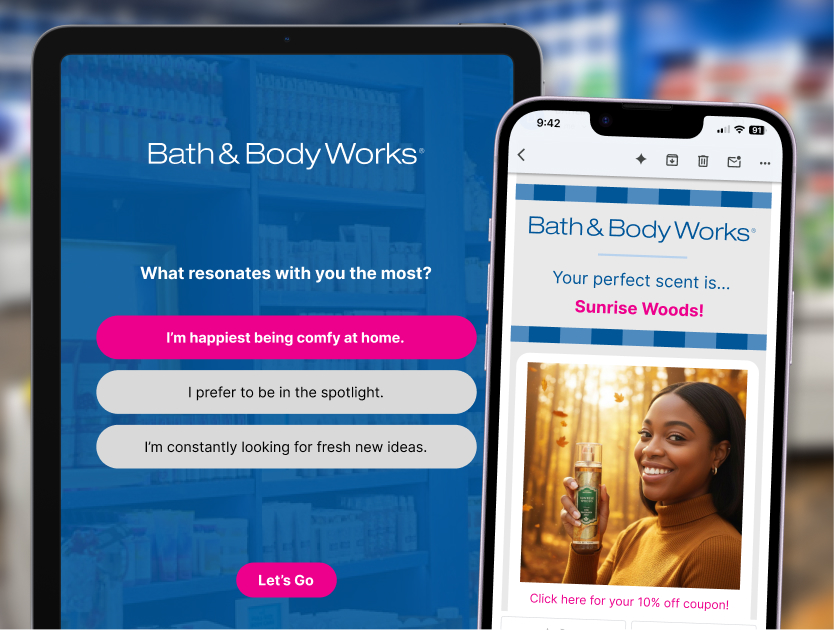
Insight: The highest-converting event leads come from a simple value exchange: the guest gets something personally valuable (a custom AI portrait, a personalized experience, useful content), and in return, they willingly share their information and preferences. This creates warmer leads than a badge scan because the person has already opted in to a positive interaction with your brand.
What Brand Metrics Matter Beyond Attendance?
Brand impact is the hardest category to measure, but ignoring it means undervaluing events that build long-term equity. Here's what to track.
Social reach and impressions. Total impressions generated from event-related social posts, both your own and attendee-created content. Events that generate shareable content consistently outperform those that rely solely on the brand's own social posting.
UGC volume and quality. How many pieces of user-generated content did your event produce? More importantly, was the content on-brand enough to reuse? Branded activations that produce visually consistent outputs (digital photo experiences with custom overlays, AI portraits with brand-aligned aesthetics) give you a library of authentic content for post-event marketing.
Share rate. Of the people who created content at your activation, what percentage shared it to their personal channels? Industry averages hover around 30 to 40%, but well-designed activations with instant delivery and compelling outputs can push this above 60%.
Direct traffic and branded search. Monitor your website analytics during and immediately after the event. Spikes in direct traffic and branded search queries indicate that the event drove awareness. Set up UTM parameters on any URLs displayed at the event to separate event-driven traffic from organic.
Content delivery open rate. If your activation delivers personalized content via email, the open rate on those delivery messages tells you how invested participants are. Industry average for marketing emails hovers around 20%. Personalized content delivery from activations can hit 95% because the recipient is opening something they created, not something you sent them.
How Do You Track Post-Event Conversions?
The event ends on Friday. The real measurement starts on Monday. Post-event conversion tracking is where most teams drop the ball, usually because the handoff between event marketing and sales isn't airtight.
CRM tagging (do it immediately). Every lead captured at the event needs a source tag in your CRM before your team leaves the venue. "Q1 Industry Conference 2026" as a lead source lets you run reports months later that show exactly what that event produced. If you wait even a week, some leads will have been entered manually, some will be duplicated, and your data quality will degrade fast.
Nurture sequence performance. Event leads require different follow-up than inbound leads. Track open rates, click rates, and reply rates on your post-event sequences separately. If your event nurture is underperforming your standard nurture, the issue is usually relevance.
Pipeline velocity. Track how quickly event leads move through your pipeline compared to other sources. Events should accelerate velocity because the in-person interaction handles a lot of the trust-building and qualification that normally happens across multiple digital touches.
Long-tail attribution. Set a 90-day and 180-day window for event attribution. B2B sales cycles are long, and some of your best event leads won't close for months. If you only measure 30-day results, you're underreporting the event's true impact.
How Do You Build an Event Measurement Plan?
A measurement plan doesn't need to be complicated. It needs to be written down before the event and followed after it. Here's a template that works.
Step 1: State the event objective. One sentence. "Generate 50 qualified leads for the enterprise sales team" or "Build brand awareness in the healthcare vertical." If you can't state it simply, your objective isn't clear enough.
Step 2: Choose 3 to 5 primary metrics. Align them to your objective. Pipeline generation events track CPL, lead-to-opportunity rate, and pipeline value. Brand events track social reach, UGC volume, and direct traffic. Pick the metrics that will actually influence whether you invest in this event again.
Step 3: Set baselines and targets. If this is a repeat event, use last year's numbers as your baseline. If it's new, use benchmarks from similar events or industry averages. Without a target, you can't evaluate performance.
Step 4: Assign ownership. Who is responsible for collecting each data point? Event lead capture data, social monitoring, CRM tagging, and post-event survey distribution should each have a named owner. Shared responsibility is no responsibility.
Step 5: Schedule the debrief. Put a meeting on the calendar for two weeks post-event (to capture initial results) and another at 90 days (to capture pipeline progression). Having the dates set before the event prevents the debrief from being perpetually postponed.
The teams that measure events well don't have bigger budgets or better tools. They have a plan, they stick to it, and they treat measurement as a core part of the event strategy rather than a reporting exercise they rush through after the fact. When you can walk into a budget meeting with a clear cost-per-lead, a lead-to-opportunity rate, and a projection of pipeline value, you're not asking for budget. You're presenting an investment case.
Ready to capture better data from your next event?
Get a QuoteOr explore: How It Works | Activation Concepts